
The Population Health Snapshot is a representation of the health of the population, at a given point in time. It is based on the Population Health Model that aims to inform individuals, communities, and organizations about the health status of the population with respect to the region they live in or provide services to. They also highlight selected determinants of health which can be influenced or improved to have a positive effect on health status. This year’s Snapshot also includes green and red flags that highlight the indicators where the province or the zone performs significantly better or worse than other provinces or other zones respectively.
Provincial Highlights: When compared to other provinces…
- New Brunswick continues to have a relatively poorer performance regarding perceived mental health (rated very good or excellent) and this seems to be getting worse.
- New Brunswick is presenting a better performance for the percentage of citizens who have a regular care provider, compared to the Canadian average.
- Chronic Obstructive Pulmonary Disease (COPD) has a great impact on hospitalizations across the province, ranked as the second leading cause of hospital admissions in New Brunswick and either as the top or second leading cause across all health zones.
- The leading cause of avoidable mortality in New Brunswick is lung cancer. This is also true for most health zones, apart from Zone 3 and Zone 5 where heart disease is the leading cause of avoidable mortality, followed by lung cancer in second rank.
- High blood pressure is the most common chronic health condition in the province, and this is consistent across all health zones.
Zone Highlights
Zone 1: Moncton and South-East Area
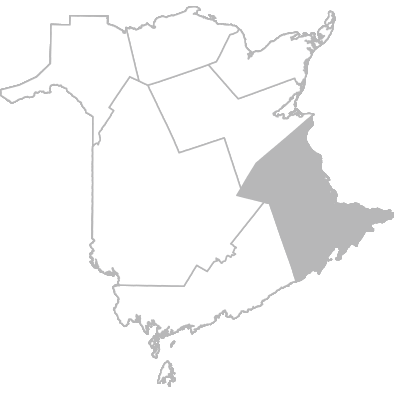
- Compared to other zones, fewer citizens in Zone 1 die prematurely because of preventable or treatable causes and this seems to be trending in the right direction.
- Fewer potential years of life are lost due to heart and stroke and Zone 1 compares favourably to the provincial average.
- Sexually transmitted infections are an area for improvement in Zone 1: Chlamydia rates are trending in the wrong direction and they are higher than the provincial average.
Zone 2: Fundy Shore and Saint John Area
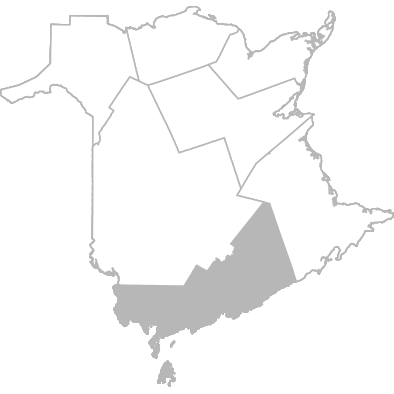
- Zone 2 is performing around the provincial average for most of the indicators in the Snapshot. However, they are showing a worse performance than the provincial average for the percentage of women aged 50 to 74 who participated in the provincial breast cancer screening program and this is trending downwards.
- The Fundy Shore and Saint John Area shows a lower than average performance for the radon concentration in homes.
Zone 3: Fredericton and River Valley Area
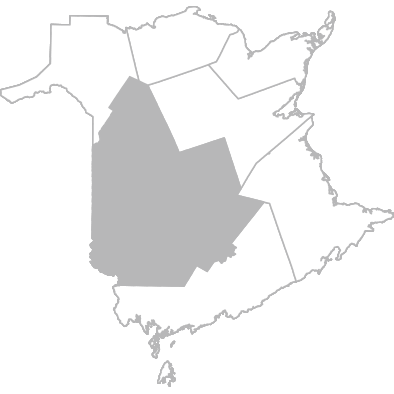
- The Fredericton and River Valley Area is showing better than average performance on two health outcome indicators and these seem to be getting better: low birth weight (2019-2020 data) and potential years of life lost from cancer. They are also showing a better than average performance for the percentage of its citizens aged 65+ who received a flu shot and this is also improving.
- Health services are an area of improvement in Zone 3. Fewer citizens rate their overall health care services received favourably (8, 9 or 10 out of 10) compared to the rest of the province and this seems to be getting worse. Additionally, access to primary care providers is worse than the provincial average and does not seem to be improving.
- Zone 3 also has a high rate of Chlamydia (and this is getting worse).
Zone 4: Madawaska and North-West Area
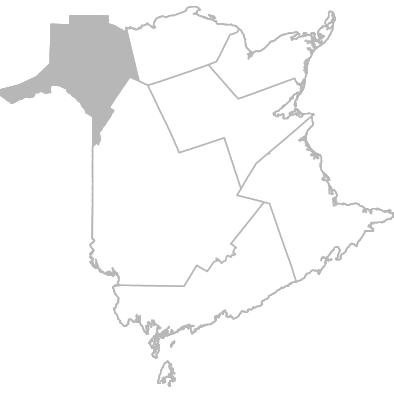
- Population health outcomes in Zone 4 seem to demonstrate a poorer performance. Citizens who rate their health as very good or excellent and potential years of life lost from suicide are higher than the provincial average and are getting worse
- The percentage of the population aged 65+ who received a flu shot in Zone 4 is lower than the provincial average and this is trending in the wrong direction.
- Physical activity, which is known to be a contributing factor for chronic health conditions is trending in the wrong direction in Zone 4, and seems to be lower than the provincial average for this indicator. However, fruit and vegetable consumption are getting better, and the zone is performing better than the provincial average for this health behaviour.
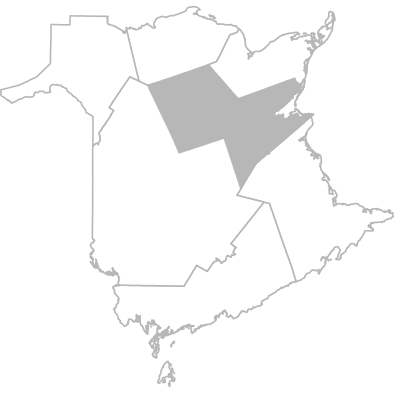
Zone 5: Restigouche Area
- Zone 5 is performing better than the provincial average and improving on two health outcomes : the percentage of citizens who report being satisfied or very satisfied with their life and infant mortality. However, the Restigouche area is performing worse than average on premature mortality and this is trending in the wrong direction.
- Linked to health behaviours, there is an improvement since the last Snapshot on citizens who reported a somewhat strong or very strong sense of belonging to their local community and the Restigouche area is performing better than the provincial average for this indicator. Moreover, this zone has a worse than average performance for teens who give birth, and this is trending in the wrong direction.
- Health services are an area for improvement in Zone 5 as they demonstrate poorer performance compared to the provincial average on three indicators : the percentage of its population aged 65+ who received their flu shot, high users of inpatient acute care services (2019-2020 data), and favorable rating (8, 9 or 10 out of 10) of hospital services received. These three indicators are trending in the wrong direction.
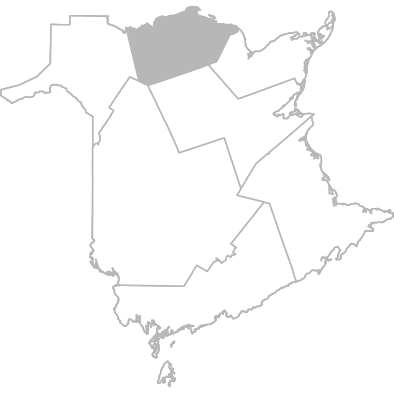
Zone 6: Bathurst and Acadian Peninsula Area
- Linked to health services, Zone 6 has a better than average performance on two indicators: Pap Smear test participation, which has improved since the last Snapshot, and favourable rating (8, 9 or 10 out of 10) of overall health services received, and this is also improving.
- Rates of Chlamydia are lower than the provincial average in Zone 6, and this is trending in the right direction.
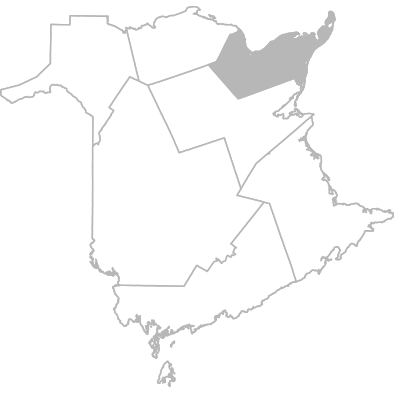
Zone 7: Miramichi Area
- Citizens who rate their mental health as very good or excellent is trending in the wrong direction in Zone 7 and this zone has a worse than average performance for this indicator. The potential years of life lost from breathing disease is getting worse and the Miramichi Area is performing worse than the provincial average for this indicator.
- Zone 7 has a higher than average avoidable hospitalizations and this is trending in the wrong direction (2019-2020 data). However, they are performing better than the provincial average for breast cancer screening program participation, and this seems to be improving.
- Zone 7 is performing worse than average for smoking and fruit and vegetable consumption and these are getting worse.
As can be observed, there is a wide variability across the provincial health zones and the health needs are different for every region. However, Chronic Obstructive Pulmonary Disease (COPD) continues to have a great impact on hospitalizations across the province, and the leading cause of avoidable mortality in New Brunswick is lung cancer. High blood pressure is the most common chronic health condition in the province, and this is consistent across all health zones.
Taking this into consideration, it is important to understand the variability in health determinants and health outcomes across health zones to better meet the needs of each respective population. This understanding is critical for health program planning and to bring improvement to indicators that have a positive effect on health status.