Table
Community
Tracadie and Saint-Isidore
|
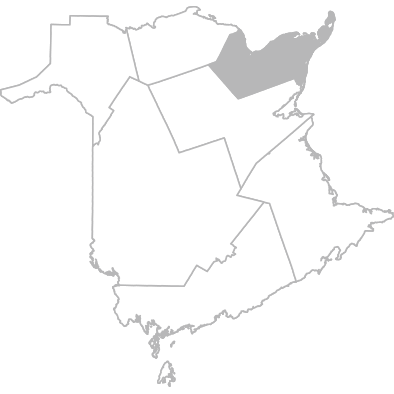
Zone 6
Bathurst and Acadian Peninsula Area
|

Province
New Brunswick
|
|
||||||||||||||||||||||||||||||||||||||||||||||
|---|---|---|---|---|---|---|---|---|---|---|---|---|---|---|---|---|---|---|---|---|---|---|---|---|---|---|---|---|---|---|---|---|---|---|---|---|---|---|---|---|---|---|---|---|---|---|---|---|---|
|
|
|||||||||||||||||||||||||||||||||||||||||||||||||
| Health status | |||||||||||||||||||||||||||||||||||||||||||||||||
| Quality of life | |||||||||||||||||||||||||||||||||||||||||||||||||
| Perceived health, very good or excellent % | 2021 |
6.7
2.7
- 10.7
|
7.2
5.4
- 9.1
|
7.9
7.3
- 8.5
|
||||||||||||||||||||||||||||||||||||||||||||||
| Perceived mental health, very good or excellent % | 2024 |
22.2
16.9
- 27.4
|
28.3
25.7
- 30.9
|
25.5
24.6
- 26.3
|
||||||||||||||||||||||||||||||||||||||||||||||
|
Prevalence of chronic health conditions
Among list of chronic conditions: arthritis, asthma, chronic pain, emphysema or COPD, cancer, diabetes, depression, mood disorder other than depression, heart disease, stroke, high blood pressure, gastric reflux, alzheimer's disease or another form of dementia, anxiety, or high cholesterol
|
|||||||||||||||||||||||||||||||||||||||||||||||||
| Five or more chronic health conditions % | 2024 |
100.0
100.0
- 100.0
|
93.8
91.6
- 96.0
|
93.1
92.3
- 94.0
|
||||||||||||||||||||||||||||||||||||||||||||||
|
Types of chronic condition (physical health)
|
|||||||||||||||||||||||||||||||||||||||||||||||||
| Hypertension % | 2024 |
55.5
49.2
- 61.8
|
54.3
51.5
- 57.2
|
53.0
52.0
- 54.0
|
||||||||||||||||||||||||||||||||||||||||||||||
| Arthritis % | 2024 |
34.4
28.3
- 40.4
|
34.7
31.9
- 37.4
|
41.5
40.5
- 42.5
|
||||||||||||||||||||||||||||||||||||||||||||||
| Diabetes % | 2024 |
36.3
30.1
- 42.4
|
32.1
29.4
- 34.8
|
32.0
31.1
- 32.9
|
||||||||||||||||||||||||||||||||||||||||||||||
| Heart disease % | 2024 |
35.6
29.5
- 41.7
|
31.8
29.1
- 34.5
|
31.1
30.2
- 32.0
|
||||||||||||||||||||||||||||||||||||||||||||||
| High cholesterol % | 2024 |
36.9
30.8
- 43.0
|
31.4
28.7
- 34.1
|
28.8
27.9
- 29.7
|
||||||||||||||||||||||||||||||||||||||||||||||
| Chronic pain % | 2024 |
40.0
33.7
- 46.2
|
28.5
25.9
- 31.1
|
27.1
26.2
- 28.0
|
||||||||||||||||||||||||||||||||||||||||||||||
| Cancer % | 2024 |
24.9
19.5
- 30.4
|
24.9
22.4
- 27.4
|
26.8
25.9
- 27.6
|
||||||||||||||||||||||||||||||||||||||||||||||
| Gastric reflux % | 2024 |
29.2
23.5
- 35.0
|
22.8
20.3
- 25.2
|
22.7
21.9
- 23.6
|
||||||||||||||||||||||||||||||||||||||||||||||
| Emphysema/COPD % | 2024 |
19.9
14.8
- 25.0
|
20.3
17.9
- 22.6
|
20.1
19.3
- 20.9
|
||||||||||||||||||||||||||||||||||||||||||||||
| Asthma % | 2024 |
23.6
18.2
- 29.1
|
20.1
17.8
- 22.4
|
17.6
16.8
- 18.4
|
||||||||||||||||||||||||||||||||||||||||||||||
| Stroke % | 2024 |
12.8
8.5
- 17.0
|
11.8
9.9
- 13.7
|
11.3
10.7
- 11.9
|
||||||||||||||||||||||||||||||||||||||||||||||
| Types of chronic health conditions (mental health) | |||||||||||||||||||||||||||||||||||||||||||||||||
| Anxiety % | 2024 |
32.1
26.2
- 38.1
|
25.1
22.6
- 27.7
|
21.0
20.2
- 21.8
|
||||||||||||||||||||||||||||||||||||||||||||||
| Depression % | 2024 |
21.0
15.8
- 26.2
|
16.6
14.4
- 18.8
|
19.3
18.5
- 20.1
|
||||||||||||||||||||||||||||||||||||||||||||||
| Mood disorder (other than depression) % | 2024 |
S
|
2.4
1.5
- 3.4
|
2.9
2.5
- 3.2
|
||||||||||||||||||||||||||||||||||||||||||||||
| Types of chronic health conditions (memory) | |||||||||||||||||||||||||||||||||||||||||||||||||
| Alzheimer's disease % | 2024 |
11.4
7.4
- 15.4
|
7.7
6.2
- 9.2
|
6.9
6.4
- 7.4
|
||||||||||||||||||||||||||||||||||||||||||||||
| Management of heath chronic conditions | |||||||||||||||||||||||||||||||||||||||||||||||||
| Confidence in managing their health condition, very confident % | 2024 |
14.2
9.5
- 18.8
|
21.5
19.0
- 24.0
|
15.5
14.7
- 16.2
|
||||||||||||||||||||||||||||||||||||||||||||||
| Care received from an informal caregiver | |||||||||||||||||||||||||||||||||||||||||||||||||
| Lives alone % | 2024 |
25.8
20.3 - 31.3
|
30.3
27.7 - 32.9
|
31.3
30.3 - 32.2
|
||||||||||||||||||||||||||||||||||||||||||||||
| In the last 2 months | |||||||||||||||||||||||||||||||||||||||||||||||||
| Received help from an informal caregiver % | 2024 |
69.2
63.3
- 75.1
|
68.7
66.1
- 71.4
|
68.8
67.8
- 69.7
|
||||||||||||||||||||||||||||||||||||||||||||||
| Received help at least once a week % | 2024 |
91.0
86.5
- 95.5
|
84.1
81.5
- 86.7
|
86.0
85.2
- 86.9
|
||||||||||||||||||||||||||||||||||||||||||||||
About this Table
Content and description
Data about self-reported health, chronic health conditions, and whether citizens received care from informal caregivers.
Why is it important?
By better understanding the characteristics of citizens receiving home care services in New Brunswick, we can better understand their needs, thus provide more citizen-centered care.
Availability of the data
The information for this data table is available at different geographical levels as well as by demographic groups. More information is available on our Home Care Survey page.
Note about demographic groups
In 2023, the NBHC undertook a review of the demographic questions in its surveys to more accurately report on the experience of citizens who identify with particular groups. As such, starting in 2024, all demographic groups (characteristics) have been adjusted to reflect this change. Data tables and indicator pages were adjusted to allow for trending where applicable.