Table
Community
Tracadie and Saint-Isidore
|
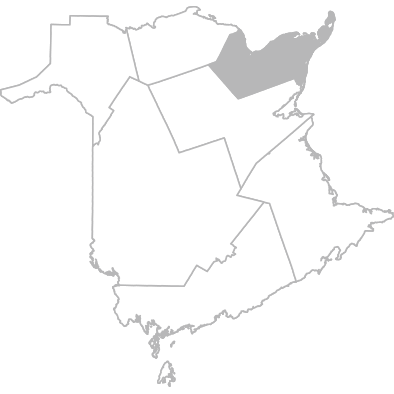
Zone 6
Bathurst and Acadian Peninsula Area
|

Province
New Brunswick
|
|
||||||||||||||||||||||||||||||||||||||||||||||
|---|---|---|---|---|---|---|---|---|---|---|---|---|---|---|---|---|---|---|---|---|---|---|---|---|---|---|---|---|---|---|---|---|---|---|---|---|---|---|---|---|---|---|---|---|---|---|---|---|---|
|
|
|||||||||||||||||||||||||||||||||||||||||||||||||
| Overall satisfaction with EMP services | |||||||||||||||||||||||||||||||||||||||||||||||||
| In the last 2 months | |||||||||||||||||||||||||||||||||||||||||||||||||
| Overall experience, good or very good % | 2024 |
99.0
97.7
- 100.0
|
98.3
97.4
- 99.1
|
96.7
96.3
- 97.1
|
||||||||||||||||||||||||||||||||||||||||||||||
| Sharing of Information | |||||||||||||||||||||||||||||||||||||||||||||||||
| In the last 12 months | |||||||||||||||||||||||||||||||||||||||||||||||||
| The staff gave them the information they needed to take care of themselves, agree or strongly agree % | 2024 |
94.9
92.1
- 97.8
|
95.4
94.2
- 96.6
|
93.2
92.7
- 93.8
|
||||||||||||||||||||||||||||||||||||||||||||||
| The staff kept them well-informed about their progress, agree or strongly agree % | 2024 |
92.9
89.5
- 96.2
|
92.0
90.4
- 93.7
|
90.6
89.9
- 91.2
|
||||||||||||||||||||||||||||||||||||||||||||||
| The staff discussed with them type of information to share with family or friends, agree or strongly agree % | 2024 |
87.1
82.2
- 92.0
|
81.1
78.5
- 83.7
|
78.3
77.3
- 79.3
|
||||||||||||||||||||||||||||||||||||||||||||||
| Informal caregivers received information they wanted when they needed it, agree or strongly agree % | 2024 |
94.2
90.9
- 97.4
|
90.4
88.5
- 92.2
|
88.7
88.0
- 89.4
|
||||||||||||||||||||||||||||||||||||||||||||||
| Communication | |||||||||||||||||||||||||||||||||||||||||||||||||
| In the last 2 months, the staff | |||||||||||||||||||||||||||||||||||||||||||||||||
| Treated them as gently as possible, always % | 2024 |
94.7
91.8
- 97.7
|
94.1
92.7
- 95.6
|
94.4
93.9
- 94.9
|
||||||||||||||||||||||||||||||||||||||||||||||
| Explained things in a way that was easy to understand, always % | 2024 |
90.1
86.0
- 94.1
|
90.9
89.1
- 92.7
|
90.1
89.5
- 90.8
|
||||||||||||||||||||||||||||||||||||||||||||||
| Listened carefully to them, always % | 2024 |
92.7
89.3
- 96.1
|
92.5
90.9
- 94.1
|
91.1
90.5
- 91.7
|
||||||||||||||||||||||||||||||||||||||||||||||
| Treated them with courtesy and respect, always % | 2024 |
96.8
94.5
- 99.1
|
97.1
96.1
- 98.1
|
96.4
96.0
- 96.8
|
||||||||||||||||||||||||||||||||||||||||||||||
| Coordination | |||||||||||||||||||||||||||||||||||||||||||||||||
| In the last 2 months, the staff | |||||||||||||||||||||||||||||||||||||||||||||||||
| Seemed informed and up-to-date about all the care they received, always % | 2024 |
78.2
71.5
- 84.8
|
78.0
74.9
- 81.0
|
78.5
77.4
- 79.6
|
||||||||||||||||||||||||||||||||||||||||||||||
| Availability of Services | |||||||||||||||||||||||||||||||||||||||||||||||||
| Experienced limits or reductions in the last 12 months | |||||||||||||||||||||||||||||||||||||||||||||||||
| In the duration of services or number of hours available % | 2018 |
8.0
|
4.8
|
6.6
|
||||||||||||||||||||||||||||||||||||||||||||||
| In the types of services available % | 2018 |
9.0
|
5.4
|
6.9
|
||||||||||||||||||||||||||||||||||||||||||||||
| Services helped in staying home | |||||||||||||||||||||||||||||||||||||||||||||||||
| In the last 2 months | |||||||||||||||||||||||||||||||||||||||||||||||||
| The services helped them stay at home % | 2024 |
100.0
100.0
- 100.0
|
98.8
98.1
- 99.4
|
97.5
97.1
- 97.8
|
||||||||||||||||||||||||||||||||||||||||||||||
| More could have been done to help them stay at home % | 2024 |
7.9
3.9
- 11.9
|
5.7
4.1
- 7.3
|
6.1
5.5
- 6.7
|
||||||||||||||||||||||||||||||||||||||||||||||
| Care received from an informal caregiver in the last 2 months | |||||||||||||||||||||||||||||||||||||||||||||||||
| Received help from an informal caregiver % | 2024 |
69.2
63.3 - 75.1
|
68.7
66.1 - 71.4
|
68.8
67.8 - 69.7
|
||||||||||||||||||||||||||||||||||||||||||||||
| Received help at least once a week % | 2024 |
91.0
86.5 - 95.5
|
84.1
81.5 - 86.7
|
86.0
85.2 - 86.9
|
||||||||||||||||||||||||||||||||||||||||||||||
About this Table
Content and description
Data about key indicators that reflect the experience citizens reported while receiving services from the Extra-Mural Program. Topics include overall satisfaction, sharing of information, communication, coordination, availability of services, services helped in staying home and care received from informal caregivers.
Why is it important?
By better understanding the experience of citizens with Extra-Mural Program services, we can better assess the quality of services. This also encourages those responsible for the program to create performance targets based on care experience survey indicators.
Availability of the data
The information for this data table is available at different geographical levels as well as by demographic groups. More information is available on our Home Care Survey page.
Note about demographic groups
In 2023, the NBHC undertook a review of the demographic questions in its surveys to more accurately report on the experience of citizens who identify with particular groups. As such, starting in 2024, all demographic groups (characteristics) have been adjusted to reflect this change. Data tables and indicator pages were adjusted to allow for trending where applicable.