Table
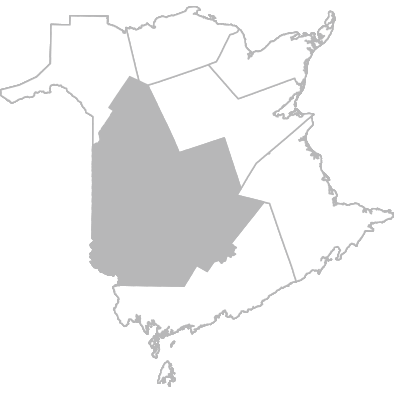
Zone 3
Fredericton and River Valley Area
|
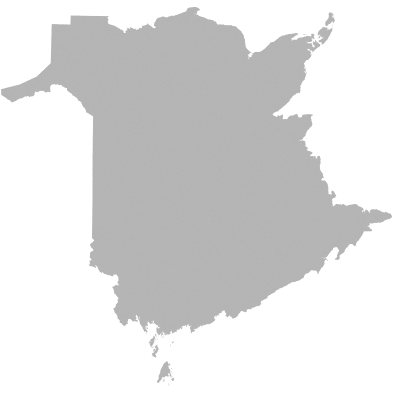
Province
New Brunswick
|
|
|||||||||||||||||||||||||||||||||||||||||||||||
|---|---|---|---|---|---|---|---|---|---|---|---|---|---|---|---|---|---|---|---|---|---|---|---|---|---|---|---|---|---|---|---|---|---|---|---|---|---|---|---|---|---|---|---|---|---|---|---|---|---|
|
|
|||||||||||||||||||||||||||||||||||||||||||||||||
| Population Demographics | |||||||||||||||||||||||||||||||||||||||||||||||||
| Land area km² | 2016 |
23,211
|
71,389
|
|||||||||||||||||||||||||||||||||||||||||||||||
| Population density Persons per km² | 2016 |
8
|
11
|
|||||||||||||||||||||||||||||||||||||||||||||||
| Population Number | 2025 |
199,904
|
869,682
|
|||||||||||||||||||||||||||||||||||||||||||||||
| 18-64 % | 2025 |
60.3
|
59.4
|
|||||||||||||||||||||||||||||||||||||||||||||||
| 65+ % | 2025 |
21.1
|
23.3
|
|||||||||||||||||||||||||||||||||||||||||||||||
| 18+ % | 2025 |
81.4
|
82.7
|
|||||||||||||||||||||||||||||||||||||||||||||||
| 0-4 Number | 2025 |
8,584
|
34,230
|
|||||||||||||||||||||||||||||||||||||||||||||||
| 5-9 Number | 2025 |
10,254
|
42,021
|
|||||||||||||||||||||||||||||||||||||||||||||||
| 10-14 Number | 2025 |
11,243
|
45,927
|
|||||||||||||||||||||||||||||||||||||||||||||||
| 15-19 Number | 2025 |
11,593
|
45,973
|
|||||||||||||||||||||||||||||||||||||||||||||||
| 20-24 Number | 2025 |
12,313
|
49,967
|
|||||||||||||||||||||||||||||||||||||||||||||||
| 25-29 Number | 2025 |
13,748
|
53,755
|
|||||||||||||||||||||||||||||||||||||||||||||||
| 30-34 Number | 2025 |
13,378
|
55,094
|
|||||||||||||||||||||||||||||||||||||||||||||||
| 35-39 Number | 2025 |
13,140
|
55,889
|
|||||||||||||||||||||||||||||||||||||||||||||||
| 40-44 Number | 2025 |
13,060
|
56,031
|
|||||||||||||||||||||||||||||||||||||||||||||||
| 45-49 Number | 2025 |
12,183
|
53,929
|
|||||||||||||||||||||||||||||||||||||||||||||||
| 50-54 Number | 2025 |
12,044
|
54,049
|
|||||||||||||||||||||||||||||||||||||||||||||||
| 55-59 Number | 2025 |
12,251
|
55,145
|
|||||||||||||||||||||||||||||||||||||||||||||||
| 60-64 Number | 2025 |
13,970
|
64,925
|
|||||||||||||||||||||||||||||||||||||||||||||||
| 65-69 Number | 2025 |
12,950
|
61,635
|
|||||||||||||||||||||||||||||||||||||||||||||||
| 70-74 Number | 2025 |
11,131
|
53,108
|
|||||||||||||||||||||||||||||||||||||||||||||||
| 75-79 Number | 2025 |
8,666
|
42,021
|
|||||||||||||||||||||||||||||||||||||||||||||||
| 80-84 Number | 2025 |
5,134
|
24,776
|
|||||||||||||||||||||||||||||||||||||||||||||||
| 85 and over Number | 2025 |
4,262
|
21,207
|
|||||||||||||||||||||||||||||||||||||||||||||||
| Population change from 2016 to 2020 % | 2016 to 2020 |
5
|
4
|
|||||||||||||||||||||||||||||||||||||||||||||||
| Indigenous % | 2021 |
5.1
|
4.4
|
|||||||||||||||||||||||||||||||||||||||||||||||
| Immigrant % | 2021 |
7.1
|
5.8
|
|||||||||||||||||||||||||||||||||||||||||||||||
| Recent immigrant in the last 5 years % | 2016 to 2021 |
2.4
|
2.1
|
|||||||||||||||||||||||||||||||||||||||||||||||
| Visible minority % | 2021 |
6.4
|
5.8
|
|||||||||||||||||||||||||||||||||||||||||||||||
| Median age of population Years | 2021 |
43
|
46
|
|||||||||||||||||||||||||||||||||||||||||||||||
| Birth rate Rate per 1,000 population | 2019 to 2023 |
9
|
8
|
|||||||||||||||||||||||||||||||||||||||||||||||
| Death rate Rate per 1,000 population | 2019 to 2023 |
10
|
10
|
|||||||||||||||||||||||||||||||||||||||||||||||
| Household | |||||||||||||||||||||||||||||||||||||||||||||||||
| Married or living common-law % | 2021 |
60
|
59
|
|||||||||||||||||||||||||||||||||||||||||||||||
| Couples with children % | 2021 |
44
|
42
|
|||||||||||||||||||||||||||||||||||||||||||||||
| Single parent families % | 2021 |
15
|
16
|
|||||||||||||||||||||||||||||||||||||||||||||||
| Average household size Number | 2021 |
2.3
|
2.3
|
|||||||||||||||||||||||||||||||||||||||||||||||
| Person living alone % | 2021 |
28
|
30
|
|||||||||||||||||||||||||||||||||||||||||||||||
| Private household with 5 or more people % | 2021 |
7
|
6
|
|||||||||||||||||||||||||||||||||||||||||||||||
| Dependents | |||||||||||||||||||||||||||||||||||||||||||||||||
| Dependency ratio Rate per 100 people in the working age population | 2019 |
67
|
70
|
|||||||||||||||||||||||||||||||||||||||||||||||
| Dependent under 20 years % | 2019 |
21
|
20
|
|||||||||||||||||||||||||||||||||||||||||||||||
| Dependent 65 years and over % | 2019 |
19
|
21
|
|||||||||||||||||||||||||||||||||||||||||||||||
| Language | |||||||||||||||||||||||||||||||||||||||||||||||||
| Language most spoken at home - English % | 2021 |
92.6
|
69.1
|
|||||||||||||||||||||||||||||||||||||||||||||||
| Language most spoken at home - French % | 2021 |
3.0
|
26.3
|
|||||||||||||||||||||||||||||||||||||||||||||||
| Language most spoken at home - English and French % | 2021 |
0.6
|
1.3
|
|||||||||||||||||||||||||||||||||||||||||||||||
| Language most spoken at home - indigenous languages % | 2021 |
0.2
|
0.2
|
|||||||||||||||||||||||||||||||||||||||||||||||
| Language most spoken at home - other languages % | 2021 |
1.3
|
1.1
|
|||||||||||||||||||||||||||||||||||||||||||||||
| Language most spoken at work - English % | 2021 |
97.1
|
75.0
|
|||||||||||||||||||||||||||||||||||||||||||||||
| Language most spoken at work - French % | 2021 |
1.6
|
21.0
|
|||||||||||||||||||||||||||||||||||||||||||||||
| Language most spoken at work - English and French % | 2021 |
1.1
|
3.7
|
|||||||||||||||||||||||||||||||||||||||||||||||
| Knowledge of official language - English only % | 2021 |
81
|
58
|
|||||||||||||||||||||||||||||||||||||||||||||||
| Knowledge of official language - French only % | 2021 |
0
|
8
|
|||||||||||||||||||||||||||||||||||||||||||||||
| Knowledge of official language - French and English % | 2021 |
19
|
34
|
|||||||||||||||||||||||||||||||||||||||||||||||
| Youth bilingualism - English and French % | 2016 |
36
|
48
|
|||||||||||||||||||||||||||||||||||||||||||||||
| Always received services from a primary care provider in their preferred language - French or English % | 2025 |
98.1
|
94.9
|
|||||||||||||||||||||||||||||||||||||||||||||||
| Always received services from a primary care provider in their preferred language - English % | 2025 |
99.3
|
97.0
|
|||||||||||||||||||||||||||||||||||||||||||||||
| Always received services from a primary care provider in their preferred language - French % | 2025 |
S
|
88.8
|
|||||||||||||||||||||||||||||||||||||||||||||||
| Persons with a disability | |||||||||||||||||||||||||||||||||||||||||||||||||
| Self-identifies as a person with a disability or special need % | 2025-2026 |
9.6
|
8.7
|
|||||||||||||||||||||||||||||||||||||||||||||||
| Type of disability for adults and seniors | |||||||||||||||||||||||||||||||||||||||||||||||||
| Seeing disability % | 2020 |
19.3
|
19.3
|
|||||||||||||||||||||||||||||||||||||||||||||||
| Hearing disability % | 2020 |
19.5
|
18.4
|
|||||||||||||||||||||||||||||||||||||||||||||||
| Mobility disability % | 2020 |
57.1
|
56.5
|
|||||||||||||||||||||||||||||||||||||||||||||||
| Flexibility disability % | 2020 |
57.5
|
54.1
|
|||||||||||||||||||||||||||||||||||||||||||||||
| Dexterity disability % | 2020 |
25.2
|
24.5
|
|||||||||||||||||||||||||||||||||||||||||||||||
| Pain-related disability % | 2020 |
70.5
|
72.4
|
|||||||||||||||||||||||||||||||||||||||||||||||
| Learning disability % | 2020 |
18.2
|
18.0
|
|||||||||||||||||||||||||||||||||||||||||||||||
| Mental health-related disability % | 2020 |
29.1
|
30.4
|
|||||||||||||||||||||||||||||||||||||||||||||||
| Memory disability % | 2020 |
26.6
|
25.9
|
|||||||||||||||||||||||||||||||||||||||||||||||
| Sexual Identity | |||||||||||||||||||||||||||||||||||||||||||||||||
| Self-identifies as 2SLGBTQIA+ % | 2025-2026 |
12.9
|
11.6
|
|||||||||||||||||||||||||||||||||||||||||||||||
About this Table
Demographic Context describe the people living in a community.
Content and description
Demographic information, such as population count, household structures, language preferences, as well as disability information and sexual minority details.
Why is this important?
Knowing who is part of the community is the first part to understanding the community dynamics.
Availability of the data
Indicators from a variety of sources are collected, organized, and analyzed by the NBHC. These various data sources are used to represent the population health of New Brunswickers. Each have various levels of reliability and limitations as detailed in the Indicator pages.
This information is available for the 33 NBHC Communities, 7 Health Zones and for New Brunswick overall.
----
The Population Health data tables provide a comprehensive view of the people who live, learn, work and take part in activities and in community life in this area.