Table
Community
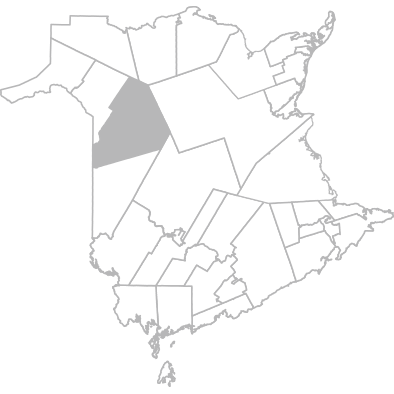
Perth-Andover, Plaster Rock, Tobique Area
|
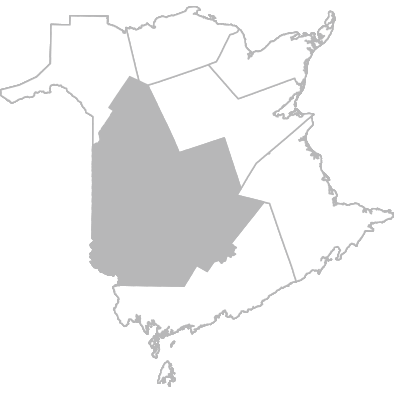
Zone 3
Fredericton and River Valley Area
|

Province
New Brunswick
|
|
||||||||||||||||||||||||||||||||||||||||||||||
|---|---|---|---|---|---|---|---|---|---|---|---|---|---|---|---|---|---|---|---|---|---|---|---|---|---|---|---|---|---|---|---|---|---|---|---|---|---|---|---|---|---|---|---|---|---|---|---|---|---|
|
|
|||||||||||||||||||||||||||||||||||||||||||||||||
| Availability of services | |||||||||||||||||||||||||||||||||||||||||||||||||
| The services started as soon as they thought they needed it % | 2021 |
85.6
78.5 - 92.7
|
90.0
87.9 - 92.0
|
89.8
88.8 - 90.7
|
||||||||||||||||||||||||||||||||||||||||||||||
| Experienced limits or reductions in the last 12 months | |||||||||||||||||||||||||||||||||||||||||||||||||
| In the duration of services or number of hours available % | 2021 |
32.2
22.5
- 42.0
|
22.3
19.4
- 25.2
|
21.7
20.4
- 23.0
|
||||||||||||||||||||||||||||||||||||||||||||||
| In the types of services available % | 2021 |
24.7
15.8
- 33.6
|
19.9
17.1
- 22.6
|
20.1
18.8
- 21.3
|
||||||||||||||||||||||||||||||||||||||||||||||
| In the last 2 months | |||||||||||||||||||||||||||||||||||||||||||||||||
| Satisfied with the number of times they received services, very satisfied % | 2021 |
74.3
65.1
- 83.5
|
71.7
68.6
- 74.8
|
67.9
66.5
- 69.4
|
||||||||||||||||||||||||||||||||||||||||||||||
| Prior to receiving services | |||||||||||||||||||||||||||||||||||||||||||||||||
| Received Information before they started getting their services, very easy or somewhat easy % | 2021 |
76.7
67.9
- 85.5
|
74.5
71.4
- 77.6
|
75.4
74.0
- 76.8
|
||||||||||||||||||||||||||||||||||||||||||||||
| Language of service | |||||||||||||||||||||||||||||||||||||||||||||||||
| Prefers receiving services in English % | 2021 |
93.2
88.2 - 98.2
|
98.2
97.3 - 99.1
|
69.4
68.0 - 70.8
|
||||||||||||||||||||||||||||||||||||||||||||||
| ...Always received services in English, in the last 2 months % | 2024 |
S
|
96.9
95.6 - 98.1
|
95.4
94.7 - 96.1
|
||||||||||||||||||||||||||||||||||||||||||||||
| Prefers receiving services in French % | 2015 |
0.0
0.0 - 0.0
|
S
|
15.1
14.0 - 16.3
|
||||||||||||||||||||||||||||||||||||||||||||||
| ...Always received services in French, in the last 2 months % |
n/a
|
n/a
|
n/a
|
||||||||||||||||||||||||||||||||||||||||||||||
| Someone offered to give them services in the official language of their choice % | 2021 |
88.6
81.7 - 95.6
|
90.0
87.8 - 92.2
|
91.5
90.6 - 92.4
|
||||||||||||||||||||||||||||||||||||||||||||||
| In the last 2 months | |||||||||||||||||||||||||||||||||||||||||||||||||
| Always received services in official language they preferred % | 2024 |
S
|
95.7
94.3
- 97.1
|
93.0
92.4
- 93.7
|
||||||||||||||||||||||||||||||||||||||||||||||
| Had a language problem with their home support worker % | 2021 |
0.0
0.0
- 0.0
|
2.4
1.4
- 3.5
|
3.1
2.6
- 3.6
|
||||||||||||||||||||||||||||||||||||||||||||||
| Experience with home support workers | |||||||||||||||||||||||||||||||||||||||||||||||||
| In the last 12 months | |||||||||||||||||||||||||||||||||||||||||||||||||
| The staff did not take their spiritual or cultural values into account % | 2021 |
0.0
0.0
- 0.0
|
1.4
0.6
- 2.3
|
2.5
2.0
- 3.0
|
||||||||||||||||||||||||||||||||||||||||||||||
| Informal caregivers received information they wanted when they needed it, agree or strongly agree % | 2024 |
S
|
86.7
84.1
- 89.3
|
88.5
87.4
- 89.5
|
||||||||||||||||||||||||||||||||||||||||||||||
| In the last 2 months, the staff | |||||||||||||||||||||||||||||||||||||||||||||||||
| Treated them as gently as possible, always % | 2021 |
93.0
87.4
- 98.5
|
86.8
84.4
- 89.2
|
86.2
85.1
- 87.3
|
||||||||||||||||||||||||||||||||||||||||||||||
| Explained things in a way that was easy to understand, always % | 2021 |
82.4
74.4
- 90.4
|
79.9
77.1
- 82.7
|
80.2
79.0
- 81.5
|
||||||||||||||||||||||||||||||||||||||||||||||
| Listened carefully to them, always % | 2021 |
75.7
66.7
- 84.7
|
75.8
72.9
- 78.8
|
77.3
76.0
- 78.6
|
||||||||||||||||||||||||||||||||||||||||||||||
| Treated them with courtesy and respect, always % | 2021 |
89.3
82.9
- 95.8
|
87.4
85.1
- 89.7
|
87.6
86.6
- 88.6
|
||||||||||||||||||||||||||||||||||||||||||||||
| Kept them informed about their arrival time, always % | 2024 |
S
|
72.5
69.4
- 75.6
|
77.9
76.8
- 79.1
|
||||||||||||||||||||||||||||||||||||||||||||||
| Seemed informed and up-to-date about all the care they received, always % | 2021 |
82.8
71.9
- 93.8
|
60.8
56.4
- 65.3
|
63.5
61.3
- 65.7
|
||||||||||||||||||||||||||||||||||||||||||||||
| Experience with services in the last 2 months | |||||||||||||||||||||||||||||||||||||||||||||||||
| The services helped them stay at home % | 2021 |
100.0
100.0 - 100.0
|
97.5
96.4 - 98.6
|
97.6
97.1 - 98.1
|
||||||||||||||||||||||||||||||||||||||||||||||
| The services were scheduled at a time that was convenient for them % | 2021 |
79.8
71.2 - 88.5
|
69.9
66.7 - 73.1
|
71.9
70.5 - 73.3
|
||||||||||||||||||||||||||||||||||||||||||||||
| More could have been done to help them stay at home % | 2021 |
13.1
5.4 - 20.7
|
11.6
9.1 - 14.1
|
13.6
12.5 - 14.8
|
||||||||||||||||||||||||||||||||||||||||||||||
| Safety | |||||||||||||||||||||||||||||||||||||||||||||||||
| In the last 12 months | |||||||||||||||||||||||||||||||||||||||||||||||||
| Believe they were harmed because of an error or mistake % | 2024 |
S
|
2.3
1.3
- 3.3
|
2.8
2.4
- 3.3
|
||||||||||||||||||||||||||||||||||||||||||||||
| Overall satisfaction | |||||||||||||||||||||||||||||||||||||||||||||||||
| In the last 2 months | |||||||||||||||||||||||||||||||||||||||||||||||||
| Overall experience, good or very good % | 2021 |
86.5
79.4
- 93.6
|
85.3
82.9
- 87.7
|
87.9
86.9
- 88.9
|
||||||||||||||||||||||||||||||||||||||||||||||
About this Table
Content and description
Data about the experience citizens reported while receiving home support services. Topics include availability of services, language of service, experience with home support workers, experience with home support services, safety, and overall satisfaction.
Why is it important?
By better understanding the experience of citizens with home support services, we can better assess the quality of services. This also encourages those responsible for the program to create performance targets based on care experience survey indicators.
Availability of the data
The information for this data table is available at different geographical levels as well as by demographic groups. More information is available on our Home Care Survey page.
Note about demographic groups
In 2023, the NBHC undertook a review of the demographic questions in its surveys to more accurately report on the experience of citizens who identify with particular groups. As such, starting in 2024, all demographic groups (characteristics) have been adjusted to reflect this change. Data tables and indicator pages were adjusted to allow for trending where applicable.