Table
Community
Shippagan, Lamèque, Inkerman Area
|
Zone 6
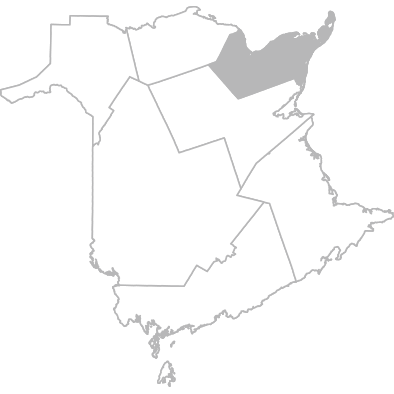
Bathurst and Acadian Peninsula Area
|
Province
New Brunswick
|
|
||||||||||||||||||||||||||||||||||||||||||||||
|---|---|---|---|---|---|---|---|---|---|---|---|---|---|---|---|---|---|---|---|---|---|---|---|---|---|---|---|---|---|---|---|---|---|---|---|---|---|---|---|---|---|---|---|---|---|---|---|---|---|
|
|
|||||||||||||||||||||||||||||||||||||||||||||||||
| Smoking and vaping | |||||||||||||||||||||||||||||||||||||||||||||||||
|
Cigarette
This section includes tobacco cigarettes that are bought ready-made and cigarettes that are made by students.
This section does not include e-cigarettes, vaping devices and other tobacco products.
|
|||||||||||||||||||||||||||||||||||||||||||||||||
| Has tried cigarette smoking % | 2023-2024 |
22.5
19.5
- 25.4
|
16.6
15.6
- 17.6
|
16.0
15.7
- 16.3
|
||||||||||||||||||||||||||||||||||||||||||||||
| Onset age Number | 2023-2024 |
S
|
14.3
13.9
- 14.6
|
14.1
14.0
- 14.2
|
||||||||||||||||||||||||||||||||||||||||||||||
| Susceptible to smoking % | 2023-2024 |
26.5
23.0
- 29.9
|
26.3
25.0
- 27.6
|
31.0
30.6
- 31.4
|
||||||||||||||||||||||||||||||||||||||||||||||
| Daily or occasional smoker % | 2024-2025 |
6.8
5.1
- 8.6
|
5.4
4.8
- 6.0
|
6.2
6.0
- 6.4
|
||||||||||||||||||||||||||||||||||||||||||||||
| Daily smoker % | 2024-2025 |
2.1
1.1
- 3.2
|
2.1
1.7
- 2.5
|
2.5
2.4
- 2.6
|
||||||||||||||||||||||||||||||||||||||||||||||
| Has a close friend who smokes % | 2023-2024 |
25.2
21.8
- 28.5
|
20.1
18.9
- 21.3
|
20.0
19.6
- 20.3
|
||||||||||||||||||||||||||||||||||||||||||||||
|
Vaping
This section includes vaping e-liquid with nicotine, without nicotine, or when students didn't know whether it contained nicotine. It includes all e-cigarettes, vaporizers and vape pens.
This section does not include vaping cannabis.
|
|||||||||||||||||||||||||||||||||||||||||||||||||
| Has tried vaping % | 2023-2024 |
35.9
32.5
- 39.3
|
28.0
26.8
- 29.3
|
24.7
24.4
- 25.1
|
||||||||||||||||||||||||||||||||||||||||||||||
| Onset age Number | 2023-2024 |
13.7
13.1
- 14.2
|
14.2
14.0
- 14.4
|
14.1
14.0
- 14.2
|
||||||||||||||||||||||||||||||||||||||||||||||
| Daily or occasional vaper % | 2024-2025 |
16.8
14.2
- 19.4
|
12.6
11.7
- 13.5
|
12.0
11.8
- 12.3
|
||||||||||||||||||||||||||||||||||||||||||||||
| Daily vaper % | 2024-2025 |
11.4
9.2
- 13.6
|
7.3
6.6
- 8.0
|
6.5
6.3
- 6.7
|
||||||||||||||||||||||||||||||||||||||||||||||
| Has a close friend who vapes % | 2023-2024 |
42.9
39.1
- 46.6
|
37.2
35.8
- 38.6
|
38.0
37.5
- 38.4
|
||||||||||||||||||||||||||||||||||||||||||||||
| Exposed to vaping smoke at home % | 2023-2024 |
21.4
18.5
- 24.4
|
17.5
16.4
- 18.5
|
17.3
17.0
- 17.6
|
||||||||||||||||||||||||||||||||||||||||||||||
| Second-hand smoke | |||||||||||||||||||||||||||||||||||||||||||||||||
| Exposed to cigarette smoke in a vehicle, last 7 days % | 2024-2025 |
18.2
15.5
- 20.9
|
17.1
16.1
- 18.2
|
17.2
16.8
- 17.5
|
||||||||||||||||||||||||||||||||||||||||||||||
| Exposed to cigarette smoke at home % | 2023-2024 |
7.0
5.2
- 8.8
|
8.4
7.6
- 9.1
|
12.9
12.6
- 13.1
|
||||||||||||||||||||||||||||||||||||||||||||||
| Alternative tobacco and nicotine products | |||||||||||||||||||||||||||||||||||||||||||||||||
| Has tried alternative tobacco and nicotine products % | 2023-2024 |
19.9
17.1
- 22.7
|
14.8
13.8
- 15.8
|
12.3
12.1
- 12.6
|
||||||||||||||||||||||||||||||||||||||||||||||
| Little cigars or cigarillos % | 2023-2024 |
17.1
14.3
- 19.8
|
11.8
10.8
- 12.7
|
9.3
9.1
- 9.6
|
||||||||||||||||||||||||||||||||||||||||||||||
| Cigars % | 2023-2024 |
14.3
11.7
- 17.0
|
9.9
9.0
- 10.8
|
7.0
6.8
- 7.2
|
||||||||||||||||||||||||||||||||||||||||||||||
| Roll-your-own cigarettes % | 2023-2024 |
7.0
5.2
- 8.9
|
6.4
5.7
- 7.1
|
5.8
5.6
- 6.0
|
||||||||||||||||||||||||||||||||||||||||||||||
| Heated tobacco products % | 2023-2024 |
6.5
4.7
- 8.4
|
5.9
5.2
- 6.6
|
5.8
5.6
- 5.9
|
||||||||||||||||||||||||||||||||||||||||||||||
| Smokeless tobacco % | 2023-2024 |
3.1
1.8
- 4.4
|
3.5
3.0
- 4.0
|
4.0
3.9
- 4.2
|
||||||||||||||||||||||||||||||||||||||||||||||
| Water pipe to smoke shisha % | 2023-2024 |
6.2
4.4
- 8.0
|
4.8
4.2
- 5.4
|
4.7
4.5
- 4.9
|
||||||||||||||||||||||||||||||||||||||||||||||
| Blunt wraps % | 2023-2024 |
2.8
1.6
- 4.0
|
3.3
2.8
- 3.8
|
4.5
4.4
- 4.7
|
||||||||||||||||||||||||||||||||||||||||||||||
| Alcohol and drugs | |||||||||||||||||||||||||||||||||||||||||||||||||
| Alcohol | |||||||||||||||||||||||||||||||||||||||||||||||||
| Has tried alcohol % | 2024-2025 |
56.1
52.4
- 59.8
|
48.6
47.1
- 50.1
|
38.3
37.9
- 38.8
|
||||||||||||||||||||||||||||||||||||||||||||||
| Onset age Number | 2023-2024 |
13.5
13.1
- 13.9
|
14.0
13.9
- 14.2
|
14.1
14.0
- 14.1
|
||||||||||||||||||||||||||||||||||||||||||||||
| Regular drinking, last 12 months % | 2024-2025 |
23.7
20.5
- 27.0
|
21.3
20.1
- 22.6
|
16.0
15.6
- 16.3
|
||||||||||||||||||||||||||||||||||||||||||||||
| Heavy drinking, once a month or more, last 12 months % | 2024-2025 |
14.6
11.9
- 17.2
|
12.3
11.4
- 13.3
|
8.7
8.4
- 8.9
|
||||||||||||||||||||||||||||||||||||||||||||||
| Has a close friend who drinks alcohol % | 2023-2024 |
50.7
47.0
- 54.5
|
48.0
46.5
- 49.5
|
41.0
40.6
- 41.5
|
||||||||||||||||||||||||||||||||||||||||||||||
| Onset age - getting drunk Number | 2023-2024 |
14.1
13.8
- 14.5
|
14.6
14.5
- 14.8
|
14.7
14.7
- 14.8
|
||||||||||||||||||||||||||||||||||||||||||||||
|
Cannabis
This section includes marijuana and any other products made from the cannabis plant, such as dry cannabis and cannabis that is mixed or processed into another product.
|
|||||||||||||||||||||||||||||||||||||||||||||||||
| Has tried cannabis % | 2024-2025 |
11.9
9.4
- 14.3
|
12.1
11.1
- 13.1
|
15.1
14.7
- 15.4
|
||||||||||||||||||||||||||||||||||||||||||||||
| Onset age Number | 2023-2024 |
S
|
14.7
14.5
- 15.0
|
14.5
14.5
- 14.6
|
||||||||||||||||||||||||||||||||||||||||||||||
| Has used cannabis, last 12 months % | 2024-2025 |
6.6
4.7
- 8.5
|
8.2
7.4
- 9.1
|
11.3
11.0
- 11.6
|
||||||||||||||||||||||||||||||||||||||||||||||
| Daily cannabis user, last 12 months % | 2024-2025 |
2.2
1.0
- 3.3
|
2.2
1.8
- 2.7
|
3.7
3.5
- 3.9
|
||||||||||||||||||||||||||||||||||||||||||||||
| Has a close friend who uses cannabis % | 2023-2024 |
22.7
19.4
- 26.0
|
21.7
20.5
- 23.0
|
26.2
25.8
- 26.5
|
||||||||||||||||||||||||||||||||||||||||||||||
| Exposed to cannabis smoke at home % | 2023-2024 |
5.0
3.4
- 6.6
|
7.3
6.5
- 8.0
|
11.8
11.5
- 12.1
|
||||||||||||||||||||||||||||||||||||||||||||||
| Drugs | |||||||||||||||||||||||||||||||||||||||||||||||||
| Has used drugs, last 12 months (excluding tobacco, alcohol and cannabis) to get high % | 2024-2025 |
27.4
24.1
- 30.7
|
29.9
28.5
- 31.2
|
30.0
29.5
- 30.4
|
||||||||||||||||||||||||||||||||||||||||||||||
| LSD and other hallucinogens % | 2024-2025 |
1.5
0.6
- 2.4
|
2.8
2.3
- 3.3
|
4.3
4.2
- 4.5
|
||||||||||||||||||||||||||||||||||||||||||||||
| Pain relievers % | 2022-2023 |
2.0
0.8
- 3.1
|
3.0
2.5
- 3.6
|
5.8
5.6
- 6.0
|
||||||||||||||||||||||||||||||||||||||||||||||
| Amphetamines % | 2018-2019 |
3.2
|
3.1
|
3.1
|
||||||||||||||||||||||||||||||||||||||||||||||
| Ecstasy, MDMA % | 2022-2023 |
1.7
0.7
- 2.8
|
2.0
1.5
- 2.4
|
2.3
2.1
- 2.4
|
||||||||||||||||||||||||||||||||||||||||||||||
| Cocaine % | 2024-2025 |
1.3
0.4
- 2.2
|
2.0
1.6
- 2.4
|
2.8
2.7
- 3.0
|
||||||||||||||||||||||||||||||||||||||||||||||
| Cough and cold medicines % | 2024-2025 |
25.1
21.9
- 28.4
|
27.2
25.9
- 28.6
|
26.3
25.9
- 26.7
|
||||||||||||||||||||||||||||||||||||||||||||||
| Stimulants % | 2024-2025 |
2.9
1.6
- 4.1
|
3.9
3.3
- 4.4
|
3.5
3.3
- 3.6
|
||||||||||||||||||||||||||||||||||||||||||||||
| Sedatives / tranquillizers % | 2022-2023 |
1.9
0.8
- 3.0
|
2.6
2.1
- 3.1
|
2.7
2.6
- 2.9
|
||||||||||||||||||||||||||||||||||||||||||||||
| Methamphetamines / Crystal methamphetamine % | 2018-2019 |
0.0
|
1.4
|
1.9
|
||||||||||||||||||||||||||||||||||||||||||||||
| Glue or solvents % | 2024-2025 |
S
|
1.5
1.2
- 1.9
|
2.5
2.3
- 2.6
|
||||||||||||||||||||||||||||||||||||||||||||||
| Heroin % | 2024-2025 |
S
|
1.6
1.2
- 1.9
|
2.1
1.9
- 2.2
|
||||||||||||||||||||||||||||||||||||||||||||||
| Other % | 2024-2025 |
3.0
1.7
- 4.3
|
3.1
2.6
- 3.6
|
4.5
4.3
- 4.7
|
||||||||||||||||||||||||||||||||||||||||||||||
| Safety | |||||||||||||||||||||||||||||||||||||||||||||||||
| Driver of an off-road vehicle - under the influence of alcohol or drugs, last 12 months % | 2024-2025 |
15.3
12.6 - 18.0
|
13.4
12.4 - 14.4
|
10.3
10.0 - 10.5
|
||||||||||||||||||||||||||||||||||||||||||||||
| Passenger in an on-road vehicle - driven by someone under the influence of alcohol or drugs, last 12 months % | 2024-2025 |
22.7
19.6 - 25.9
|
17.7
16.6 - 18.8
|
14.8
14.5 - 15.1
|
||||||||||||||||||||||||||||||||||||||||||||||
About this Table
Content and description
This table presents data collected from students in grades 6 to 12 through the New Brunswick Student Wellness and Education Survey (SWES). It contains self-reported information regarding the use of substances among New Brunswick students in grades 6 to 12. Substances include cigarettes, electronic cigarettes, alcohol, cannabis, and other drugs.
The questionnaire comprises modules, which means that certain questions are asked every other cycle.
Why it is important
Only when we understand who our students are and what their needs are can we better plan for services and allocate resources to meet their health and educational needs.
Availability of the data
The information in this data table is available by school district, school sector and overall New Brunswick,by the seven (7) New Brunswick health zones and 33 communities created by the NBHC, as well as by demographic groups. More information is available on our New Brunswick Student Wellness and Education Survey page.
Note about demographic groups:
In 2023, the NBHC undertook a review of the demographic questions in its surveys to more accurately report on the experience of citizens who identify with particular groups. As such, starting in 2024, all demographic groups (characteristics) have been adjusted to reflect this change. Data tables and indicator pages were adjusted to allow for trending where applicable.