Table
               
                
                  Community
                 
                
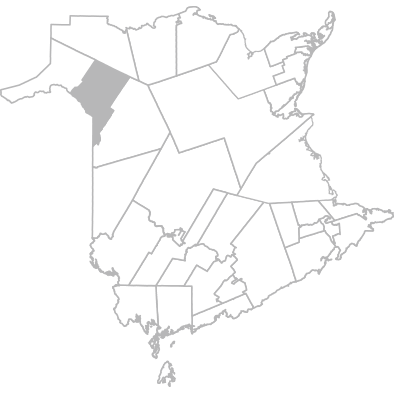
                  Grand Falls, Saint-Léonard, Drummond Area
                 
                                   | 


                  Zone 4
                 
                
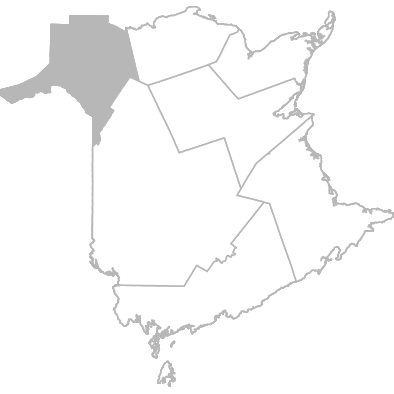
                  Madawaska and North-West Area
                 
                                   | 


                  Province
                 
                
                  New Brunswick
                 
                                   | 
                                
                 | 
                  ||||||||||||||||||||||||||||||||||||||||||||||
|---|---|---|---|---|---|---|---|---|---|---|---|---|---|---|---|---|---|---|---|---|---|---|---|---|---|---|---|---|---|---|---|---|---|---|---|---|---|---|---|---|---|---|---|---|---|---|---|---|---|
| 
             | 
        |||||||||||||||||||||||||||||||||||||||||||||||||
| General health | |||||||||||||||||||||||||||||||||||||||||||||||||
| Perceived health, very good or excellent % | 2024-2025 | 
         
                    
            48.4


              45.7 - 51.0
             
                   | 


            55.0


              53.4 - 56.6
             
                   | 


            46.9


              46.5 - 47.3
             
                   | 
      ||||||||||||||||||||||||||||||||||||||||||||||
| 
      Weights
       Overweight and obesity in childhood and adolescence have been associated with elevated health risks and morbidities, and increased mortality rates in adulthood. They are risk factors for a large number of serious diseases and conditions like high blood pressure, heart disease, diabetes, stroke, some cancers, and mental health problems. 
     | 
  |||||||||||||||||||||||||||||||||||||||||||||||||
| Overweight or obese % | 2024-2025 | 
           
                        
              25.7


                22.5
                - 28.8
               
                       | 


              27.4


                25.5
                - 29.3
               
                       | 


              27.0


                26.5
                - 27.4
               
                       | 
          ||||||||||||||||||||||||||||||||||||||||||||||
| Physical activity, leisure screen time, and sleep | |||||||||||||||||||||||||||||||||||||||||||||||||
| Physical activity | |||||||||||||||||||||||||||||||||||||||||||||||||
| Daily physical activity, 1 hour or more % | 2024-2025 | 
           
                        
              22.6


                20.3
                - 24.8
               
                       | 


              22.6


                21.3
                - 24.0
               
                       | 


              23.9


                23.5
                - 24.2
               
                       | 
          ||||||||||||||||||||||||||||||||||||||||||||||
| Participates in before lunch, noon hour, or after school physical activity organized by school % | 2024-2025 | 
           
                        
              46.3


                43.5
                - 49.1
               
                       | 


              43.2


                41.5
                - 44.8
               
                       | 


              40.1


                39.7
                - 40.5
               
                       | 
          ||||||||||||||||||||||||||||||||||||||||||||||
| School commute | |||||||||||||||||||||||||||||||||||||||||||||||||
| Commutes actively % | 2024-2025 | 
           
                        
              10.4


                8.7
                - 12.1
               
                       | 


              10.5


                9.6
                - 11.5
               
                       | 


              10.1


                9.8
                - 10.3
               
                       | 
          ||||||||||||||||||||||||||||||||||||||||||||||
| Commutes inactively % | 2024-2025 | 
           
                        
              78.6


                76.3
                - 80.9
               
                       | 


              77.4


                76.0
                - 78.7
               
                       | 


              77.0


                76.7
                - 77.4
               
                       | 
          ||||||||||||||||||||||||||||||||||||||||||||||
| Mixed (actively and inactively) % | 2024-2025 | 
           
                        
              11.0


                9.2
                - 12.7
               
                       | 


              12.1


                11.0
                - 13.1
               
                       | 


              12.9


                12.6
                - 13.1
               
                       | 
          ||||||||||||||||||||||||||||||||||||||||||||||
| Leisure screen time | |||||||||||||||||||||||||||||||||||||||||||||||||
| Has 2 hours or less of leisure screen time per day % | 2024-2025 | 
           
                        
              15.2


                13.2
                - 17.2
               
                       | 


              13.4


                12.3
                - 14.5
               
                       | 


              12.3


                12.0
                - 12.6
               
                       | 
          ||||||||||||||||||||||||||||||||||||||||||||||
| Average hours and minutes of leisure screen time per day Number | 2024-2025 | 
           
                        
              4.5


                4.4
                - 4.6
               
                       | 


              4.5


                4.5
                - 4.6
               
                       | 


              4.7


                4.7
                - 4.7
               
                       | 
          ||||||||||||||||||||||||||||||||||||||||||||||
| Spends 3 hours or more playing games on an electronic device, weekdays % | 2024-2025 | 
           
                        
              23.9


                21.5
                - 26.3
               
                       | 


              23.6


                22.2
                - 25.0
               
                       | 


              24.3


                24.0
                - 24.7
               
                       | 
          ||||||||||||||||||||||||||||||||||||||||||||||
| Sleep | |||||||||||||||||||||||||||||||||||||||||||||||||
| Sleeps 8 hours or more, weekdays % | 2024-2025 | 
           
                        
              65.3


                62.7
                - 67.9
               
                       | 


              68.0


                66.5
                - 69.5
               
                       | 


              61.4


                61.0
                - 61.8
               
                       | 
          ||||||||||||||||||||||||||||||||||||||||||||||
| Average hours and minutes of sleep per night Number | 2024-2025 | 
           
                        
              9.1


                8.9
                - 9.3
               
                       | 


              9.0


                8.9
                - 9.1
               
                       | 


              8.8


                8.8
                - 8.8
               
                       | 
          ||||||||||||||||||||||||||||||||||||||||||||||
| Uses an electronic device before bed % | 2023-2024 | 
           
                        
              86.3


                84.5
                - 88.1
               
                       | 


              87.9


                86.9
                - 88.9
               
                       | 


              88.9


                88.7
                - 89.1
               
                       | 
          ||||||||||||||||||||||||||||||||||||||||||||||
| Uses it 1 to 3 nights a week % | 2023-2024 | 
             
                            
                12.4


                  10.7
                  - 14.2
                 
                           | 


                13.0


                  11.9
                  - 14.0
                 
                           | 


                14.7


                  14.5
                  - 15.0
                 
                           | 
              ||||||||||||||||||||||||||||||||||||||||||||||
| Uses it every night % | 2023-2024 | 
             
                            
                63.8


                  61.2
                  - 66.4
                 
                           | 


                63.7


                  62.1
                  - 65.2
                 
                           | 


                62.1


                  61.7
                  - 62.5
                 
                           | 
              ||||||||||||||||||||||||||||||||||||||||||||||
| Has trouble going to sleep % | 2023-2024 | 
           
                        
              60.8


                58.2
                - 63.5
               
                       | 


              59.0


                57.4
                - 60.6
               
                       | 


              60.9


                60.5
                - 61.3
               
                       | 
          ||||||||||||||||||||||||||||||||||||||||||||||
| Healthy eating
    
     Canada’s Food Guide recommends eating a variety of healthy foods each day, including plenty of vegetables and fruits, and to limit highly processed foods. It also recommends to eat without distractions. 
   | 
|||||||||||||||||||||||||||||||||||||||||||||||||
| Type of food and drinks | |||||||||||||||||||||||||||||||||||||||||||||||||
| Eats vegetables or fruits 5 times or more per day % | 2024-2025 | 
           
                        
              61.5


                58.7
                - 64.2
               
                       | 


              57.1


                55.5
                - 58.8
               
                       | 


              52.3


                51.9
                - 52.7
               
                       | 
          ||||||||||||||||||||||||||||||||||||||||||||||
| Eats highly processed foods 1 time or none per day % | 2024-2025 | 
           
                        
              34.3


                31.6
                - 37.0
               
                       | 


              34.8


                33.3
                - 36.4
               
                       | 


              32.7


                32.3
                - 33.1
               
                       | 
          ||||||||||||||||||||||||||||||||||||||||||||||
| Drinks sugary drinks % | 2024-2025 | 
           
                        
              68.0


                65.3
                - 70.6
               
                       | 


              67.0


                65.5
                - 68.6
               
                       | 


              68.0


                67.6
                - 68.4
               
                       | 
          ||||||||||||||||||||||||||||||||||||||||||||||
| Drinks high energy drinks % | 2024-2025 | 
           
                        
              25.6


                23.1
                - 28.1
               
                       | 


              20.8


                19.5
                - 22.2
               
                       | 


              19.4


                19.1
                - 19.7
               
                       | 
          ||||||||||||||||||||||||||||||||||||||||||||||
| Eating habits | |||||||||||||||||||||||||||||||||||||||||||||||||
| Did not eat a meal from a fast food restaurant, last 7 days % | 2023-2024 | 
           
                        
              26.7


                24.4
                - 29.1
               
                       | 


              29.0


                27.5
                - 30.4
               
                       | 


              32.2


                31.9
                - 32.6
               
                       | 
          ||||||||||||||||||||||||||||||||||||||||||||||
| Ate a meal from a fast food restaurant 3 times or more, last 7 days % | 2023-2024 | 
             
                            
                16.1


                  14.1
                  - 18.1
                 
                           | 


                15.3


                  14.1
                  - 16.6
                 
                           | 


                12.6


                  12.3
                  - 12.8
                 
                           | 
              ||||||||||||||||||||||||||||||||||||||||||||||
| Did not eat while using an electronic device, last 7 days % | 2023-2024 | 
           
                        
              32.5


                30.0
                - 35.0
               
                       | 


              34.2


                32.7
                - 35.8
               
                       | 


              24.5


                24.2
                - 24.9
               
                       | 
          ||||||||||||||||||||||||||||||||||||||||||||||
| Ate 7 times or more while using an electronic device, last 7 days % | 2023-2024 | 
             
                            
                14.7


                  12.7
                  - 16.6
                 
                           | 


                14.3


                  13.2
                  - 15.5
                 
                           | 


                20.3


                  20.0
                  - 20.6
                 
                           | 
              ||||||||||||||||||||||||||||||||||||||||||||||
| Eats the evening meal with family/guardian(s) or friends, daily % | 2023-2024 | 
           
                        
              57.5


                54.8
                - 60.1
               
                       | 


              60.7


                59.1
                - 62.3
               
                       | 


              44.1


                43.7
                - 44.4
               
                       | 
          ||||||||||||||||||||||||||||||||||||||||||||||
| Eats the evening meal with family/guardian(s) or friends, most days % | 2023-2024 | 
             
                            
                73.1


                  70.7
                  - 75.5
                 
                           | 


                75.2


                  73.8
                  - 76.6
                 
                           | 


                59.4


                  59.1
                  - 59.8
                 
                           | 
              ||||||||||||||||||||||||||||||||||||||||||||||
| Eats breakfast, daily % | 2023-2024 | 
           
                        
              32.7


                30.2
                - 35.2
               
                       | 


              36.8


                35.2
                - 38.3
               
                       | 


              35.6


                35.3
                - 36.0
               
                       | 
          ||||||||||||||||||||||||||||||||||||||||||||||
| Eats breakfast, most days % | 2023-2024 | 
             
                            
                45.7


                  43.0
                  - 48.3
                 
                           | 


                49.9


                  48.3
                  - 51.6
                 
                           | 


                47.5


                  47.1
                  - 47.9
                 
                           | 
              ||||||||||||||||||||||||||||||||||||||||||||||
| Barriers to daily breakfast | |||||||||||||||||||||||||||||||||||||||||||||||||
| No time % | 2023-2024 | 
           
                        
              23.0


                20.7
                - 25.3
               
                       | 


              23.0


                21.5
                - 24.4
               
                       | 


              26.6


                26.3
                - 27.0
               
                       | 
          ||||||||||||||||||||||||||||||||||||||||||||||
| Not hungry % | 2023-2024 | 
           
                        
              37.8


                35.2
                - 40.4
               
                       | 


              38.4


                36.8
                - 40.0
               
                       | 


              36.0


                35.6
                - 36.3
               
                       | 
          ||||||||||||||||||||||||||||||||||||||||||||||
| Feels sick after breakfast % | 2023-2024 | 
           
                        
              16.4


                14.4
                - 18.5
               
                       | 


              14.6


                13.4
                - 15.8
               
                       | 


              16.3


                16.0
                - 16.6
               
                       | 
          ||||||||||||||||||||||||||||||||||||||||||||||
| Tries to lose weight % | 2023-2024 | 
           
                        
              9.7


                8.1
                - 11.3
               
                       | 


              9.3


                8.3
                - 10.2
               
                       | 


              10.6


                10.4
                - 10.9
               
                       | 
          ||||||||||||||||||||||||||||||||||||||||||||||
| Has nothing to eat at home % | 2023-2024 | 
           
                        
              4.6


                3.4
                - 5.7
               
                       | 


              3.0


                2.4
                - 3.6
               
                       | 


              3.6


                3.5
                - 3.8
               
                       | 
          ||||||||||||||||||||||||||||||||||||||||||||||
| Safety | |||||||||||||||||||||||||||||||||||||||||||||||||
| Driver of an off-road vehicle - under the influence of alcohol or drugs, last 12 months % | 2024-2025 | 
         
                    
            14.7


              12.6 - 16.9
             
                   | 


            14.9


              13.6 - 16.2
             
                   | 


            10.3


              10.0 - 10.5
             
                   | 
      ||||||||||||||||||||||||||||||||||||||||||||||
| Passenger in an on-road vehicle - driven by someone under the influence of alcohol or drugs, last 12 months % | 2024-2025 | 
         
                    
            15.9


              13.6 - 18.2
             
                   | 


            19.1


              17.7 - 20.6
             
                   | 


            14.8


              14.5 - 15.1
             
                   | 
      ||||||||||||||||||||||||||||||||||||||||||||||
| Sexual violence | |||||||||||||||||||||||||||||||||||||||||||||||||
| Has been sexually violated % | 2024-2025 | 
         
                    
            16.8


              14.4 - 19.1
             
                   | 


            15.5


              14.1 - 16.8
             
                   | 


            12.5


              12.2 - 12.8
             
                   | 
      ||||||||||||||||||||||||||||||||||||||||||||||
| Victim of dating violence, last 12 months (among those who dated) % | 2024-2025 | 
         
                    
            12.7


              10.4 - 14.9
             
                   | 


            12.4


              11.0 - 13.8
             
                   | 


            13.4


              13.0 - 13.7
             
                   | 
      ||||||||||||||||||||||||||||||||||||||||||||||
| Knows when legally able to consent to sexual activity % | 2024-2025 | 
         
                    
            63.8


              60.8 - 66.8
             
                   | 


            68.3


              66.6 - 69.9
             
                   | 


            70.3


              69.9 - 70.7
             
                   | 
      ||||||||||||||||||||||||||||||||||||||||||||||
About this Table
Content and description
This table presents data collected from students in grades 6 to 12 through the New Brunswick Student Wellness and Education Survey (SWES). It contains self-reported information regarding the social and emotional development of New Brunswick students in grades 6 to 12. Topics include general health, physical activity, screen time, sleep, healthy eating, safety, and sexual violence.
The questionnaire comprises modules, which means that certain questions are asked every other cycle.
Why it is important
Only when we understand who our students are and what their needs are can we better plan for services and allocate resources to meet their health and educational needs.
 
Availability of the data
The information in this data table is available by school district, school sector and overall New Brunswick,by the seven (7) New Brunswick health zones and 33 communities created by the NBHC, as well as by demographic groups. More information is available on our New Brunswick Student Wellness and Education Survey page.
 
Note about demographic groups:
In 2023, the NBHC undertook a review of the demographic questions in its surveys to more accurately report on the experience of citizens who identify with particular groups. As such, starting in 2024, all demographic groups (characteristics) have been adjusted to reflect this change. Data tables and indicator pages were adjusted to allow for trending where applicable.