Table
Community
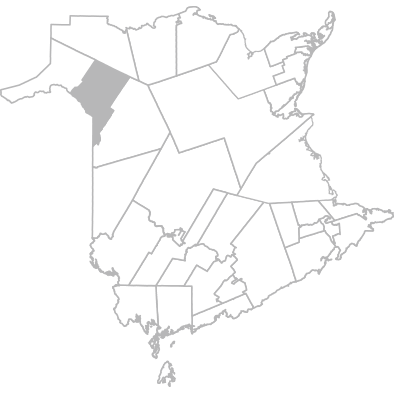
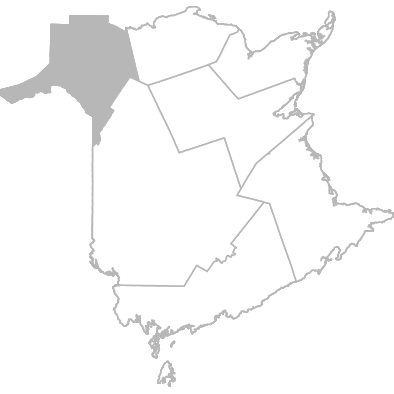
Grand Falls, Saint-Léonard, Drummond Area
|
Zone 4
Madawaska and North-West Area
|

Province
New Brunswick
|
|
||||||||||||||||||||||||||||||||||||||||||||||
|---|---|---|---|---|---|---|---|---|---|---|---|---|---|---|---|---|---|---|---|---|---|---|---|---|---|---|---|---|---|---|---|---|---|---|---|---|---|---|---|---|---|---|---|---|---|---|---|---|---|
|
|
|||||||||||||||||||||||||||||||||||||||||||||||||
| Availability of services | |||||||||||||||||||||||||||||||||||||||||||||||||
| The services started as soon as they thought they needed them % | 2024 |
94.3
91.5 - 97.1
|
96.0
94.6 - 97.3
|
96.3
95.9 - 96.6
|
||||||||||||||||||||||||||||||||||||||||||||||
| Experienced limits or reductions in the last 12 months | |||||||||||||||||||||||||||||||||||||||||||||||||
| In the duration of services or number of hours available % | 2024 |
8.2
4.7
- 11.7
|
9.2
7.2
- 11.2
|
6.8
6.3
- 7.4
|
||||||||||||||||||||||||||||||||||||||||||||||
| In the types of services available % | 2024 |
10.6
6.8
- 14.5
|
9.7
7.6
- 11.8
|
7.0
6.4
- 7.5
|
||||||||||||||||||||||||||||||||||||||||||||||
| In the last 2 months | |||||||||||||||||||||||||||||||||||||||||||||||||
| Satisfied with the number of times they received services, very satisfied % | 2024 |
66.0
60.1
- 71.9
|
67.5
64.2
- 70.9
|
77.7
76.8
- 78.5
|
||||||||||||||||||||||||||||||||||||||||||||||
| Availability of information | |||||||||||||||||||||||||||||||||||||||||||||||||
| While receiving services | |||||||||||||||||||||||||||||||||||||||||||||||||
| Knows who to contact for a complaint about the services % | 2024 |
68.6
62.5
- 74.6
|
58.2
54.7
- 61.7
|
73.1
72.1
- 74.0
|
||||||||||||||||||||||||||||||||||||||||||||||
| When contacting the Extra-Mural Program office in the last 2 months | |||||||||||||||||||||||||||||||||||||||||||||||||
| Received the help or advice they needed, always % | 2024 |
98.7
97.0
- 100.0
|
97.6
96.2
- 99.0
|
97.2
96.6
- 97.7
|
||||||||||||||||||||||||||||||||||||||||||||||
| Language of service | |||||||||||||||||||||||||||||||||||||||||||||||||
| Prefers receiving services in English % | 2024 |
18.2
13.8 - 22.6
|
8.8
6.9 - 10.6
|
72.9
72.4 - 73.5
|
||||||||||||||||||||||||||||||||||||||||||||||
| ...Always received services in English, in the last 2 months % | 2024 |
S
|
S
|
97.4
97.0 - 97.8
|
||||||||||||||||||||||||||||||||||||||||||||||
| Prefers receiving services in French % | 2024 |
64.0
58.5 - 69.5
|
82.0
79.7 - 84.4
|
21.6
21.1 - 22.1
|
||||||||||||||||||||||||||||||||||||||||||||||
| ...Always received services in French, in the last 2 months % | 2024 |
96.1
93.3 - 98.9
|
96.0
94.7 - 97.4
|
94.6
93.7 - 95.4
|
||||||||||||||||||||||||||||||||||||||||||||||
| Someone offered to give them services in the official language of their choice % | 2024 |
95.5
93.0 - 98.0
|
96.7
95.4 - 97.9
|
95.2
94.8 - 95.7
|
||||||||||||||||||||||||||||||||||||||||||||||
| In the last 2 months | |||||||||||||||||||||||||||||||||||||||||||||||||
| Always received services in official language they preferred % | 2024 |
94.0
91.2
- 96.8
|
95.2
93.8
- 96.6
|
96.4
96.1
- 96.8
|
||||||||||||||||||||||||||||||||||||||||||||||
| Had a language problem with staff % | 2018 |
0.0
0.0
- 0.0
|
S
|
0.8
0.6
- 1.0
|
||||||||||||||||||||||||||||||||||||||||||||||
| Experience with Extra-Mural Program staff | |||||||||||||||||||||||||||||||||||||||||||||||||
| At the start of receiving services | |||||||||||||||||||||||||||||||||||||||||||||||||
| Someone talked about how to set up their home so they could move around safely % | 2024 |
89.0
85.0
- 93.0
|
92.2
90.2
- 94.1
|
87.1
86.4
- 87.8
|
||||||||||||||||||||||||||||||||||||||||||||||
| The staff allowed them to set their goals and priorities, agree or strongly agree % | 2024 |
84.9
80.3
- 89.5
|
87.3
84.9
- 89.6
|
83.5
82.7
- 84.3
|
||||||||||||||||||||||||||||||||||||||||||||||
| In the last 12 months | |||||||||||||||||||||||||||||||||||||||||||||||||
| The staff gave them the information needed to take care of themselves, agree or strongly agree % | 2024 |
91.3
87.8
- 94.8
|
93.2
91.5
- 95.0
|
93.2
92.7
- 93.8
|
||||||||||||||||||||||||||||||||||||||||||||||
| The staff kept them well-informed about their progress, agree or strongly agree % | 2024 |
91.4
87.9
- 94.9
|
93.6
91.9
- 95.3
|
90.6
89.9
- 91.2
|
||||||||||||||||||||||||||||||||||||||||||||||
| The staff discussed with them what type of information could be shared with family or friends, agree or strongly agree % | 2024 |
78.4
72.9
- 84.0
|
79.2
76.1
- 82.3
|
78.3
77.3
- 79.3
|
||||||||||||||||||||||||||||||||||||||||||||||
| Informal caregivers received information that they wanted when they needed it, agree or strongly agree % | 2024 |
85.6
81.0
- 90.3
|
89.2
86.8
- 91.5
|
88.7
88.0
- 89.4
|
||||||||||||||||||||||||||||||||||||||||||||||
| The staff encouraged them to do things for themselves, agree or strongly agree % | 2024 |
93.1
89.9
- 96.3
|
95.7
94.3
- 97.1
|
92.8
92.2
- 93.3
|
||||||||||||||||||||||||||||||||||||||||||||||
| The staff did not take their spiritual or cultural values into account % | 2021 |
0.0
0.0
- 0.0
|
S
|
0.8
0.6
- 1.0
|
||||||||||||||||||||||||||||||||||||||||||||||
| In the last 2 months | |||||||||||||||||||||||||||||||||||||||||||||||||
| The staff treated them as gently as possible, always % | 2024 |
91.1
87.3
- 94.8
|
90.3
88.2
- 92.5
|
94.4
93.9
- 94.9
|
||||||||||||||||||||||||||||||||||||||||||||||
| The staff explained things in a way that was easy to understand, always % | 2024 |
88.7
84.7
- 92.7
|
87.4
85.0
- 89.7
|
90.1
89.5
- 90.8
|
||||||||||||||||||||||||||||||||||||||||||||||
| The staff listened carefully to them, always % | 2024 |
89.9
86.1
- 93.7
|
90.5
88.4
- 92.6
|
91.1
90.5
- 91.7
|
||||||||||||||||||||||||||||||||||||||||||||||
| The staff treated them with courtesy and respect, always % | 2024 |
93.7
90.5
- 96.8
|
95.1
93.6
- 96.7
|
96.4
96.0
- 96.8
|
||||||||||||||||||||||||||||||||||||||||||||||
| Had problems with the staff % | 2021 |
0.0
0.0
- 0.0
|
S
|
1.7
1.4
- 2.0
|
||||||||||||||||||||||||||||||||||||||||||||||
| The satff seemed informed and up-to-date about all the care they received, always % | 2024 |
78.5
72.1
- 84.9
|
82.6
79.4
- 85.8
|
78.5
77.4
- 79.6
|
||||||||||||||||||||||||||||||||||||||||||||||
| Never received conflicting information % | 2024 |
78.8
72.0
- 85.6
|
82.6
79.1
- 86.1
|
89.6
88.8
- 90.5
|
||||||||||||||||||||||||||||||||||||||||||||||
| The staff kept them informed about their arrival time, always % | 2024 |
88.4
84.4
- 92.4
|
90.6
88.6
- 92.7
|
87.7
86.9
- 88.4
|
||||||||||||||||||||||||||||||||||||||||||||||
| Experience with Extra-Mural Program services | |||||||||||||||||||||||||||||||||||||||||||||||||
| In the last 2 months | |||||||||||||||||||||||||||||||||||||||||||||||||
| The services helped them stay at home % | 2024 |
97.6
95.6
- 99.7
|
97.8
96.8
- 98.9
|
97.5
97.1
- 97.8
|
||||||||||||||||||||||||||||||||||||||||||||||
| More could have been done to help them stay at home % | 2021 |
9.0
4.7
- 13.3
|
8.0
5.5
- 10.4
|
6.4
5.7
- 7.1
|
||||||||||||||||||||||||||||||||||||||||||||||
| In the last 12 months | |||||||||||||||||||||||||||||||||||||||||||||||||
| Was admitted to the hospital for a condition that they felt could have been prevented with better services from this program % | 2024 |
S
|
4.6
3.2
- 6.0
|
2.5
2.2
- 2.8
|
||||||||||||||||||||||||||||||||||||||||||||||
| Went to the hospital emergency department % | 2024 |
32.7
27.1
- 38.3
|
30.9
27.8
- 33.9
|
29.9
29.0
- 30.9
|
||||||||||||||||||||||||||||||||||||||||||||||
| Continuity of care | |||||||||||||||||||||||||||||||||||||||||||||||||
| Experienced a positive continuity of care across different services % | 2024 |
78.2
69.4 - 87.1
|
79.2
74.5 - 83.9
|
71.9
70.4 - 73.4
|
||||||||||||||||||||||||||||||||||||||||||||||
| Hospital staff explained what services they would be receiving at home % | 2024 |
93.2
89.5 - 96.9
|
90.4
88.0 - 92.8
|
87.3
86.5 - 88.1
|
||||||||||||||||||||||||||||||||||||||||||||||
| Their family doctor or nurse practitioner seemed informed about their home care services % | 2024 |
98.3
96.8 - 99.8
|
98.4
97.6 - 99.3
|
96.4
96.0 - 96.8
|
||||||||||||||||||||||||||||||||||||||||||||||
| Safety | |||||||||||||||||||||||||||||||||||||||||||||||||
| In the last 12 months | |||||||||||||||||||||||||||||||||||||||||||||||||
| Believed they were harmed because of an error or mistake % | 2024 |
0.0
0.0
- 0.0
|
S
|
1.7
1.4
- 1.9
|
||||||||||||||||||||||||||||||||||||||||||||||
| In the last 2 months | |||||||||||||||||||||||||||||||||||||||||||||||||
| The staff washed their hands before providing person-to-person care, always % | 2024 |
82.6
77.6
- 87.6
|
84.9
82.3
- 87.5
|
80.2
79.3
- 81.1
|
||||||||||||||||||||||||||||||||||||||||||||||
| Medications | |||||||||||||||||||||||||||||||||||||||||||||||||
| When they first started receiving services | |||||||||||||||||||||||||||||||||||||||||||||||||
| Someone from the program talked to them about their medications % | 2024 |
89.5
85.7
- 93.3
|
88.2
86.0
- 90.5
|
88.3
87.6
- 89.0
|
||||||||||||||||||||||||||||||||||||||||||||||
| Someone from the program asked to see their medication % | 2024 |
96.0
93.7
- 98.2
|
94.7
93.3
- 96.1
|
90.4
89.8
- 91.0
|
||||||||||||||||||||||||||||||||||||||||||||||
| Overall satisfaction | |||||||||||||||||||||||||||||||||||||||||||||||||
| Would recommend the Extra-Mural Program to family or friends, definitely % | 2024 |
90.4
86.9 - 93.8
|
92.1
90.3 - 93.9
|
89.1
88.4 - 89.7
|
||||||||||||||||||||||||||||||||||||||||||||||
| In the last 2 months | |||||||||||||||||||||||||||||||||||||||||||||||||
| Overall experience, good or very good % | 2024 |
96.1
93.7
- 98.5
|
97.6
96.5
- 98.7
|
96.7
96.3
- 97.1
|
||||||||||||||||||||||||||||||||||||||||||||||
About this Table
Content and description
Data about the experience citizens reported while receiving services from the Extra-Mural Program. Topics include availability of services, availability of information, language of service, experience with program staff, experience with program services, continuity of care, safety, medication and overall satisfaction.
Why is it important?
By better understanding the experience of citizens with Extra-Mural Program services, we can better assess the quality of services. This also encourages those responsible for the program to create performance targets based on care experience survey indicators.
Availability of the data
The information for this data table is available at different geographical levels as well as by demographic groups. More information is available on our Home Care Survey page.
Note about demographic groups
In 2023, the NBHC undertook a review of the demographic questions in its surveys to more accurately report on the experience of citizens who identify with particular groups. As such, starting in 2024, all demographic groups (characteristics) have been adjusted to reflect this change. Data tables and indicator pages were adjusted to allow for trending where applicable.