Table
Community
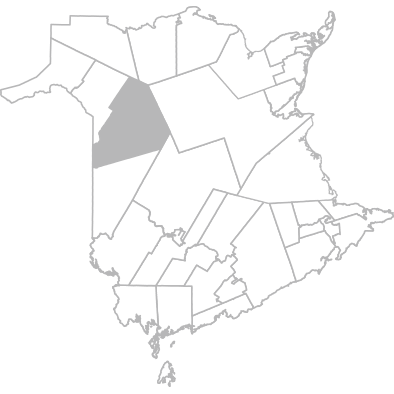
Perth-Andover, Plaster Rock, Tobique Area
|
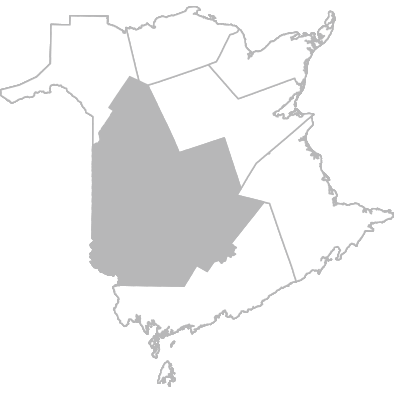
Zone 3
Fredericton and River Valley Area
|
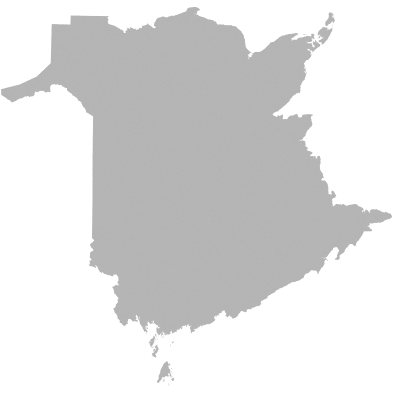
Province
New Brunswick
|
|
||||||||||||||||||||||||||||||||||||||||||||||
|---|---|---|---|---|---|---|---|---|---|---|---|---|---|---|---|---|---|---|---|---|---|---|---|---|---|---|---|---|---|---|---|---|---|---|---|---|---|---|---|---|---|---|---|---|---|---|---|---|---|
|
|
|||||||||||||||||||||||||||||||||||||||||||||||||
| Mental fitness
Mental fitness encompasses the psychological needs for competence, autonomy, and relatedness.
|
|||||||||||||||||||||||||||||||||||||||||||||||||
| Levels of mental fitness | |||||||||||||||||||||||||||||||||||||||||||||||||
| High level of mental fitness % | 2024-2025 |
13.3
10.7
- 15.9
|
22.8
22.2
- 23.5
|
25.6
25.2
- 25.9
|
||||||||||||||||||||||||||||||||||||||||||||||
| Moderate level of mental fitness % | 2024-2025 |
56.4
52.7
- 60.2
|
56.7
55.8
- 57.5
|
55.7
55.3
- 56.0
|
||||||||||||||||||||||||||||||||||||||||||||||
| Low level of mental fitness % | 2024-2025 |
30.3
26.8
- 33.7
|
20.5
19.8
- 21.2
|
18.8
18.4
- 19.1
|
||||||||||||||||||||||||||||||||||||||||||||||
| Mental fitness needs | |||||||||||||||||||||||||||||||||||||||||||||||||
| Need for autonomy highly satisfied % | 2024-2025 |
56.5
52.8
- 60.3
|
65.7
64.9
- 66.5
|
68.7
68.3
- 69.0
|
||||||||||||||||||||||||||||||||||||||||||||||
| Need for competence highly satisfied % | 2024-2025 |
65.8
62.2
- 69.4
|
77.4
76.7
- 78.1
|
78.6
78.3
- 78.9
|
||||||||||||||||||||||||||||||||||||||||||||||
| Need for relatedness highly satisfied % | 2024-2025 |
73.1
69.8
- 76.5
|
82.9
82.3
- 83.6
|
83.8
83.5
- 84.1
|
||||||||||||||||||||||||||||||||||||||||||||||
|
Life domains of mental fitness
Below are students reporting "Really true for me” for the scale items.
|
|||||||||||||||||||||||||||||||||||||||||||||||||
| Needs highly satisfied by family % | 2024-2025 |
75.2
72.0
- 78.5
|
80.7
80.0
- 81.3
|
82.3
82.0
- 82.6
|
||||||||||||||||||||||||||||||||||||||||||||||
| I feel free to express myself at home % | 2024-2025 |
47.7
43.8
- 51.5
|
55.7
54.9
- 56.6
|
56.8
56.4
- 57.2
|
||||||||||||||||||||||||||||||||||||||||||||||
| I have a choice about when and how to do my household chores % | 2024-2025 |
28.3
24.9
- 31.8
|
34.8
34.0
- 35.6
|
37.3
37.0
- 37.7
|
||||||||||||||||||||||||||||||||||||||||||||||
| I feel I do things well at home % | 2024-2025 |
37.1
33.4
- 40.8
|
46.9
46.1
- 47.7
|
47.6
47.2
- 48.0
|
||||||||||||||||||||||||||||||||||||||||||||||
| I feel my parent(s)/guardian(s) think that I am good at things. % | 2024-2025 |
52.2
48.4
- 56.0
|
60.6
59.8
- 61.4
|
60.3
60.0
- 60.7
|
||||||||||||||||||||||||||||||||||||||||||||||
| My parent(s)/guardian(s) like me and care about me. % | 2024-2025 |
70.0
66.5
- 73.5
|
77.6
76.9
- 78.3
|
78.5
78.2
- 78.8
|
||||||||||||||||||||||||||||||||||||||||||||||
| I like to spend time with my parent(s)/guardian(s). % | 2024-2025 |
51.2
47.4
- 55.0
|
58.6
57.8
- 59.4
|
59.7
59.3
- 60.1
|
||||||||||||||||||||||||||||||||||||||||||||||
| Needs highly satisfied by friends % | 2024-2025 |
76.9
73.8
- 80.1
|
83.9
83.3
- 84.5
|
83.9
83.6
- 84.2
|
||||||||||||||||||||||||||||||||||||||||||||||
| I feel free to express myself with my friends % | 2024-2025 |
48.0
44.2
- 51.8
|
54.2
53.4
- 55.1
|
54.3
53.9
- 54.7
|
||||||||||||||||||||||||||||||||||||||||||||||
| I have a choice about which activities to do with my friends % | 2024-2025 |
36.9
33.2
- 40.6
|
45.5
44.7
- 46.4
|
46.5
46.1
- 46.9
|
||||||||||||||||||||||||||||||||||||||||||||||
| I feel I do things well when I am with my friends % | 2024-2025 |
41.8
38.0
- 45.5
|
48.9
48.1
- 49.7
|
48.2
47.8
- 48.6
|
||||||||||||||||||||||||||||||||||||||||||||||
| I feel my friends think I am good at things % | 2024-2025 |
34.7
31.0
- 38.3
|
43.5
42.7
- 44.4
|
44.0
43.7
- 44.4
|
||||||||||||||||||||||||||||||||||||||||||||||
| My friends like me and care about me % | 2024-2025 |
44.4
40.6
- 48.1
|
56.0
55.1
- 56.8
|
54.1
53.7
- 54.5
|
||||||||||||||||||||||||||||||||||||||||||||||
| I like to spend time with my friends % | 2024-2025 |
63.0
59.3
- 66.7
|
72.2
71.5
- 73.0
|
72.0
71.6
- 72.4
|
||||||||||||||||||||||||||||||||||||||||||||||
| Needs highly satisfied by school % | 2024-2025 |
41.8
38.0
- 45.5
|
54.7
53.9
- 55.6
|
59.4
59.0
- 59.8
|
||||||||||||||||||||||||||||||||||||||||||||||
| I feel free to express myself at school % | 2024-2025 |
18.0
15.0
- 21.0
|
23.1
22.4
- 23.7
|
25.5
25.1
- 25.8
|
||||||||||||||||||||||||||||||||||||||||||||||
| I have a choice about when and how to do my schoolwork % | 2024-2025 |
20.8
17.6
- 23.9
|
28.0
27.3
- 28.8
|
33.3
32.9
- 33.6
|
||||||||||||||||||||||||||||||||||||||||||||||
| I feel I do things well at school % | 2024-2025 |
24.3
21.0
- 27.6
|
33.4
32.6
- 34.2
|
37.2
36.8
- 37.6
|
||||||||||||||||||||||||||||||||||||||||||||||
| I feel my teachers think I am good at things % | 2024-2025 |
23.1
19.9
- 26.4
|
29.1
28.3
- 29.8
|
32.3
32.0
- 32.7
|
||||||||||||||||||||||||||||||||||||||||||||||
| My teachers like me and care about me % | 2024-2025 |
27.3
23.9
- 30.7
|
33.1
32.3
- 33.9
|
36.0
35.6
- 36.4
|
||||||||||||||||||||||||||||||||||||||||||||||
| I like to be with my teachers % | 2024-2025 |
15.2
12.4
- 18.0
|
20.1
19.5
- 20.8
|
23.0
22.7
- 23.4
|
||||||||||||||||||||||||||||||||||||||||||||||
| Social factors | |||||||||||||||||||||||||||||||||||||||||||||||||
|
Resilience
Resilience is a strength that will help youth bounce back from adversity, but it is not solely something residing
inside the individual. Rather, it a socio-ecological model where individual strengths, along with one’s caregivers
and community, make it possible for a youth to find and access the right supports, programs and services for
their needs. Below the average score are students reporting “ Yes" for the scale items.
© 2019 by Philip Jefferies, Ph.D., Lisa McGarrigle, Ph.D., and Michael Ungar, Ph.D.
|
|||||||||||||||||||||||||||||||||||||||||||||||||
| Average resilience score (scale from 17 to 51) % | 2024-2025 |
42.8
42.3
- 43.3
|
44.7
44.6
- 44.7
|
44.8
44.8
- 44.9
|
||||||||||||||||||||||||||||||||||||||||||||||
| I get along with people around me % | 2024-2025 |
36.2
32.5
- 39.8
|
50.7
49.8
- 51.5
|
53.9
53.5
- 54.3
|
||||||||||||||||||||||||||||||||||||||||||||||
| Getting an education is important to me % | 2024-2025 |
70.6
67.1
- 74.0
|
76.1
75.4
- 76.8
|
75.2
74.8
- 75.5
|
||||||||||||||||||||||||||||||||||||||||||||||
| I know how to behave in different situations % | 2024-2025 |
66.6
63.1
- 70.2
|
76.3
75.6
- 77.0
|
76.0
75.7
- 76.4
|
||||||||||||||||||||||||||||||||||||||||||||||
| My parents(s)/caregiver(s) really look out for me % | 2024-2025 |
77.3
74.1
- 80.5
|
83.4
82.8
- 84.0
|
83.8
83.5
- 84.0
|
||||||||||||||||||||||||||||||||||||||||||||||
| My parent(s)/caregiver(s) know a lot about me % | 2024-2025 |
62.3
58.6
- 66.0
|
69.8
69.0
- 70.5
|
70.8
70.4
- 71.2
|
||||||||||||||||||||||||||||||||||||||||||||||
| If I am hungry, I can get food to eat % | 2024-2025 |
81.3
78.4
- 84.3
|
86.4
85.8
- 87.0
|
87.1
86.8
- 87.3
|
||||||||||||||||||||||||||||||||||||||||||||||
| People like to spend time with me % | 2024-2025 |
47.8
43.9
- 51.6
|
59.5
58.7
- 60.3
|
61.3
60.9
- 61.7
|
||||||||||||||||||||||||||||||||||||||||||||||
| I talk to my family/caregiver(s) about how I feel % | 2024-2025 |
35.8
32.1
- 39.4
|
44.1
43.3
- 45.0
|
44.7
44.3
- 45.1
|
||||||||||||||||||||||||||||||||||||||||||||||
| I feel supported by my friends % | 2024-2025 |
52.2
48.4
- 56.0
|
61.8
61.0
- 62.6
|
62.2
61.8
- 62.6
|
||||||||||||||||||||||||||||||||||||||||||||||
| I feel that I belong at my school % | 2024-2025 |
34.6
31.0
- 38.3
|
44.4
43.6
- 45.2
|
48.1
47.7
- 48.5
|
||||||||||||||||||||||||||||||||||||||||||||||
| My family/caregiver(s) stand by me during difficult times % | 2024-2025 |
63.7
60.1
- 67.4
|
72.9
72.2
- 73.6
|
73.3
72.9
- 73.6
|
||||||||||||||||||||||||||||||||||||||||||||||
| My friends stand by me during difficult times % | 2024-2025 |
53.6
49.8
- 57.4
|
61.7
60.9
- 62.5
|
61.5
61.1
- 61.9
|
||||||||||||||||||||||||||||||||||||||||||||||
| I am treated fairly in my community % | 2024-2025 |
50.3
46.5
- 54.1
|
62.2
61.4
- 63.0
|
64.5
64.1
- 64.9
|
||||||||||||||||||||||||||||||||||||||||||||||
| I have chances to show others that I am responsible and can do things by myself % | 2024-2025 |
62.8
59.2
- 66.5
|
70.5
69.7
- 71.3
|
71.0
70.7
- 71.4
|
||||||||||||||||||||||||||||||||||||||||||||||
| I feel safe when I am with my family/caregiver(s) % | 2024-2025 |
78.4
75.3
- 81.6
|
84.3
83.7
- 84.9
|
84.6
84.3
- 84.9
|
||||||||||||||||||||||||||||||||||||||||||||||
| I have chances to learn things that will be useful when I am older % | 2024-2025 |
71.5
68.1
- 74.9
|
77.4
76.7
- 78.1
|
78.0
77.6
- 78.3
|
||||||||||||||||||||||||||||||||||||||||||||||
| I like the way my family/caregiver(s) celebrate things % | 2024-2025 |
77.1
73.9
- 80.3
|
82.5
81.8
- 83.1
|
81.3
81.0
- 81.6
|
||||||||||||||||||||||||||||||||||||||||||||||
|
Pro-social behaviours
Pro-social behaviours are actions intended to benefit others. Below are students reporting 4, 5 or 6 on a scale ranging from 1 to 6, where 1 is “Definitely not like me” and 6 is “Definitely like me.”
|
|||||||||||||||||||||||||||||||||||||||||||||||||
| High level of pro-social behaviour % | 2024-2025 |
80.2
77.2
- 83.2
|
87.5
86.9
- 88.0
|
89.0
88.7
- 89.2
|
||||||||||||||||||||||||||||||||||||||||||||||
| I do favours for people % | 2024-2025 |
66.0
62.4
- 69.6
|
71.5
70.7
- 72.2
|
74.8
74.4
- 75.1
|
||||||||||||||||||||||||||||||||||||||||||||||
| I lend things to people % | 2024-2025 |
51.7
47.9
- 55.5
|
58.9
58.1
- 59.8
|
62.1
61.7
- 62.5
|
||||||||||||||||||||||||||||||||||||||||||||||
| I help people % | 2024-2025 |
66.9
63.4
- 70.5
|
75.8
75.1
- 76.5
|
78.0
77.7
- 78.3
|
||||||||||||||||||||||||||||||||||||||||||||||
| I compliment people % | 2024-2025 |
67.5
63.9
- 71.1
|
74.8
74.0
- 75.5
|
76.2
75.8
- 76.5
|
||||||||||||||||||||||||||||||||||||||||||||||
| I share things with people % | 2024-2025 |
57.9
54.2
- 61.7
|
66.1
65.4
- 66.9
|
68.0
67.6
- 68.4
|
||||||||||||||||||||||||||||||||||||||||||||||
|
Oppositional behaviours
Oppositional behaviours are disruptive actions that can be a nuisance to the individual or to others. Below are students reporting 3, 4, 5 or 6 on a scale ranging from 1 to 6, where 1 is “Definitely not like me” and 6 is “Definitely like me.”
|
|||||||||||||||||||||||||||||||||||||||||||||||||
| High level of oppositional behaviour % | 2024-2025 |
32.7
29.2
- 36.3
|
21.3
20.6
- 22.0
|
21.7
21.4
- 22.1
|
||||||||||||||||||||||||||||||||||||||||||||||
| I cut classes or skip school % | 2024-2025 |
25.0
21.7
- 28.3
|
18.4
17.8
- 19.1
|
17.1
16.8
- 17.4
|
||||||||||||||||||||||||||||||||||||||||||||||
| I make other people do what I want % | 2024-2025 |
19.3
16.3
- 22.3
|
15.6
15.0
- 16.2
|
19.1
18.8
- 19.5
|
||||||||||||||||||||||||||||||||||||||||||||||
| I disobey my parent(s)/guardians. % | 2024-2025 |
25.6
22.3
- 29.0
|
19.1
18.4
- 19.7
|
18.1
17.8
- 18.5
|
||||||||||||||||||||||||||||||||||||||||||||||
| I talk back to my teachers % | 2024-2025 |
26.5
23.2
- 29.8
|
15.6
15.0
- 16.2
|
16.2
15.9
- 16.5
|
||||||||||||||||||||||||||||||||||||||||||||||
| I get into fights % | 2024-2025 |
21.6
18.6
- 24.7
|
14.0
13.4
- 14.6
|
13.2
12.9
- 13.5
|
||||||||||||||||||||||||||||||||||||||||||||||
| I often say mean things to people to get what I want % | 2024-2025 |
15.8
13.0
- 18.6
|
8.6
8.2
- 9.1
|
8.8
8.6
- 9.1
|
||||||||||||||||||||||||||||||||||||||||||||||
| I take things that are not mine % | 2024-2025 |
10.7
8.3
- 13.0
|
7.3
6.9
- 7.7
|
7.6
7.4
- 7.8
|
||||||||||||||||||||||||||||||||||||||||||||||
|
Bullying at school, last 2 months
It is BULLYING when a person or group of people hurts or upsets someone on purpose, and more than once. It is different from an argument, conflict or fight because the person being bullied has difficulty defending herself or himself.
|
|||||||||||||||||||||||||||||||||||||||||||||||||
| Victim of bullying at school, last 2 months % | 2024-2025 |
55.7
51.8
- 59.6
|
49.4
48.6
- 50.3
|
47.3
46.9
- 47.7
|
||||||||||||||||||||||||||||||||||||||||||||||
| Physical attacks % | 2024-2025 |
13.3
10.7
- 15.9
|
10.4
9.9
- 11.0
|
10.0
9.8
- 10.2
|
||||||||||||||||||||||||||||||||||||||||||||||
| Verbal attacks % | 2024-2025 |
36.4
32.7
- 40.1
|
31.7
30.9
- 32.5
|
29.4
29.1
- 29.8
|
||||||||||||||||||||||||||||||||||||||||||||||
| Online bullying % | 2024-2025 |
18.5
15.5
- 21.5
|
13.8
13.2
- 14.4
|
13.0
12.7
- 13.3
|
||||||||||||||||||||||||||||||||||||||||||||||
| Exclusion % | 2024-2025 |
29.5
26.0
- 33.0
|
26.0
25.3
- 26.8
|
24.7
24.4
- 25.1
|
||||||||||||||||||||||||||||||||||||||||||||||
| Theft/vandalism % | 2024-2025 |
15.1
12.4
- 17.8
|
14.7
14.1
- 15.3
|
14.4
14.1
- 14.6
|
||||||||||||||||||||||||||||||||||||||||||||||
| Comments on personal features % | 2024-2025 |
26.0
22.6
- 29.4
|
21.0
20.4
- 21.7
|
19.5
19.1
- 19.8
|
||||||||||||||||||||||||||||||||||||||||||||||
| Sexual comments/gestures % | 2024-2025 |
26.7
23.3
- 30.1
|
19.4
18.7
- 20.1
|
18.1
17.7
- 18.4
|
||||||||||||||||||||||||||||||||||||||||||||||
| Bullied another student, last 2 months % | 2023-2024 |
19.9
16.8
- 22.9
|
12.5
12.0
- 13.0
|
12.1
11.8
- 12.4
|
||||||||||||||||||||||||||||||||||||||||||||||
|
Responses when victim of bullying
Among students who have been bullied
|
|||||||||||||||||||||||||||||||||||||||||||||||||
| I ignored it % | 2024-2025 |
52.6
47.9
- 57.3
|
53.6
52.5
- 54.7
|
56.4
55.9
- 56.9
|
||||||||||||||||||||||||||||||||||||||||||||||
| I stood up to the bully or fought back % | 2024-2025 |
24.3
20.4
- 28.3
|
26.5
25.6
- 27.5
|
26.2
25.8
- 26.7
|
||||||||||||||||||||||||||||||||||||||||||||||
| I tried talking to the bully % | 2024-2025 |
5.6
3.5
- 7.6
|
9.3
8.6
- 9.9
|
8.4
8.1
- 8.7
|
||||||||||||||||||||||||||||||||||||||||||||||
| I told an adult at the school about it % | 2024-2025 |
16.7
13.2
- 20.2
|
15.2
14.4
- 15.9
|
14.2
13.9
- 14.6
|
||||||||||||||||||||||||||||||||||||||||||||||
| I told an another adult outside of school about it % | 2024-2025 |
19.2
15.6
- 22.9
|
22.6
21.7
- 23.5
|
21.0
20.6
- 21.5
|
||||||||||||||||||||||||||||||||||||||||||||||
| I told another student about it % | 2024-2025 |
14.2
10.9
- 17.5
|
17.3
16.5
- 18.1
|
16.0
15.6
- 16.4
|
||||||||||||||||||||||||||||||||||||||||||||||
| I called a helpline or other support service % | 2024-2025 |
1.8
0.6
- 3.0
|
1.3
1.0
- 1.5
|
1.2
1.1
- 1.3
|
||||||||||||||||||||||||||||||||||||||||||||||
| Mental health | |||||||||||||||||||||||||||||||||||||||||||||||||
| General mental health | |||||||||||||||||||||||||||||||||||||||||||||||||
| Life satisfaction (scale from 0-10) Number | 2024-2025 |
6.7
6.5
- 6.9
|
7.0
7.0
- 7.1
|
7.2
7.2
- 7.2
|
||||||||||||||||||||||||||||||||||||||||||||||
| Perceived mental health, very good or excellent % | 2024-2025 |
29.7
26.2
- 33.1
|
35.7
34.9
- 36.5
|
38.7
38.3
- 39.1
|
||||||||||||||||||||||||||||||||||||||||||||||
| Mental health risk factors | |||||||||||||||||||||||||||||||||||||||||||||||||
| Spends 3 hours or more per day on social media % | 2024-2025 |
64.9
61.2
- 68.5
|
56.6
55.7
- 57.4
|
57.2
56.8
- 57.6
|
||||||||||||||||||||||||||||||||||||||||||||||
| Lonely, most or all of the time, last 12 months % | 2023-2024 |
27.7
24.2
- 31.1
|
24.5
23.8
- 25.2
|
23.4
23.1
- 23.8
|
||||||||||||||||||||||||||||||||||||||||||||||
| Difficulty sleeping, most or all of the time % | 2023-2024 |
72.1
68.6
- 75.5
|
61.8
61.0
- 62.5
|
60.9
60.5
- 61.3
|
||||||||||||||||||||||||||||||||||||||||||||||
| Symptoms of anxiety and depression | |||||||||||||||||||||||||||||||||||||||||||||||||
| Symptoms of anxiety, last 12 months % | 2024-2025 |
54.2
50.4
- 58.1
|
48.3
47.4
- 49.1
|
45.0
44.6
- 45.4
|
||||||||||||||||||||||||||||||||||||||||||||||
| Symptoms of depression, last 12 months % | 2024-2025 |
53.2
49.3
- 57.0
|
43.1
42.2
- 43.9
|
39.4
39.0
- 39.8
|
||||||||||||||||||||||||||||||||||||||||||||||
| Symptoms of anxiety or depression, last 12 months % | 2024-2025 |
64.3
60.6
- 68.0
|
54.8
54.0
- 55.7
|
51.1
50.7
- 51.5
|
||||||||||||||||||||||||||||||||||||||||||||||
| Resources | |||||||||||||||||||||||||||||||||||||||||||||||||
| Mental and emotional support, last 12 months | |||||||||||||||||||||||||||||||||||||||||||||||||
| Needed to see someone for a mental or emotional problem % | 2023-2024 |
37.7
34.0
- 41.4
|
34.8
34.0
- 35.6
|
33.1
32.8
- 33.5
|
||||||||||||||||||||||||||||||||||||||||||||||
| Needed to see someone for a mental or emotional problem, but did not see someone % | 2023-2024 |
8.1
6.1
- 10.2
|
7.4
7.0
- 7.9
|
7.0
6.8
- 7.2
|
||||||||||||||||||||||||||||||||||||||||||||||
| Reasons for not seeing someone | |||||||||||||||||||||||||||||||||||||||||||||||||
| I am waiting for my first appointment % | 2023-2024 |
S
|
8.3
6.6
- 10.0
|
9.1
8.3
- 10.0
|
||||||||||||||||||||||||||||||||||||||||||||||
| I did not feel help was available % | 2023-2024 |
21.4
10.2
- 32.6
|
19.3
16.8
- 21.8
|
20.7
19.4
- 21.9
|
||||||||||||||||||||||||||||||||||||||||||||||
| I thought the problem would go away on its own % | 2023-2024 |
38.5
25.4
- 51.6
|
34.4
31.5
- 37.3
|
36.3
34.8
- 37.8
|
||||||||||||||||||||||||||||||||||||||||||||||
| I was told the wait time would be too long % | 2023-2024 |
S
|
5.8
4.3
- 7.3
|
5.8
5.0
- 6.5
|
||||||||||||||||||||||||||||||||||||||||||||||
| I felt uncomfortable going for help % | 2023-2024 |
52.0
38.5
- 65.5
|
53.3
50.2
- 56.3
|
51.8
50.3
- 53.4
|
||||||||||||||||||||||||||||||||||||||||||||||
| I did not know where to go to get help % | 2023-2024 |
42.8
29.3
- 56.2
|
24.7
22.0
- 27.4
|
23.3
21.9
- 24.6
|
||||||||||||||||||||||||||||||||||||||||||||||
| Other % | 2023-2024 |
18.6
8.0
- 29.3
|
20.3
17.8
- 22.8
|
18.5
17.3
- 19.7
|
||||||||||||||||||||||||||||||||||||||||||||||
| Awareness of resources | |||||||||||||||||||||||||||||||||||||||||||||||||
| Aware of the LINK Program % | 2023-2024 |
24.9
21.5
- 28.2
|
23.2
22.5
- 23.9
|
25.9
25.5
- 26.2
|
||||||||||||||||||||||||||||||||||||||||||||||
| And has used it % | 2023-2024 |
1.6
0.7
- 2.5
|
1.8
1.6
- 2.0
|
1.9
1.8
- 2.0
|
||||||||||||||||||||||||||||||||||||||||||||||
| But has not used it % | 2023-2024 |
23.3
20.0
- 26.6
|
21.4
20.7
- 22.1
|
24.0
23.7
- 24.3
|
||||||||||||||||||||||||||||||||||||||||||||||
| Aware of Bridge the GAPP % | 2023-2024 |
19.1
16.0
- 22.1
|
17.4
16.8
- 18.1
|
15.1
14.8
- 15.4
|
||||||||||||||||||||||||||||||||||||||||||||||
| And has used it % | 2023-2024 |
S
|
1.3
1.1
- 1.5
|
1.3
1.2
- 1.3
|
||||||||||||||||||||||||||||||||||||||||||||||
| But has not used it % | 2023-2024 |
18.0
15.0
- 20.9
|
16.1
15.5
- 16.7
|
13.8
13.5
- 14.1
|
||||||||||||||||||||||||||||||||||||||||||||||
| Aware of Kids Help Phone % | 2023-2024 |
74.0
70.6
- 77.3
|
63.3
62.5
- 64.1
|
54.5
54.1
- 54.9
|
||||||||||||||||||||||||||||||||||||||||||||||
| And has used it % | 2023-2024 |
6.3
4.5
- 8.2
|
5.2
4.9
- 5.6
|
4.3
4.2
- 4.5
|
||||||||||||||||||||||||||||||||||||||||||||||
| But has not used it % | 2023-2024 |
67.6
64.1
- 71.2
|
58.0
57.2
- 58.9
|
50.1
49.8
- 50.5
|
||||||||||||||||||||||||||||||||||||||||||||||
About this Table
Content and description
This table presents data collected from students in grades 6 to 12 through the New Brunswick Student Wellness and Education Survey (SWES). It contains self-reported information regarding the social and emotional development of New Brunswick students in grades 6 to 12. Topics include mental fitness, social factors like resilience, pro-social behaviours, oppositional behaviours and bullying, mental health, and resources for mental and emotional health.
The questionnaire comprises modules, which means that certain questions are asked every other cycle.
Why it is important
Only when we understand who our students are and what their needs are can we better plan for services and allocate resources to meet their health and educational needs.
Availability of the data
The information in this data table is available by school district, school sector and overall New Brunswick,by the seven (7) New Brunswick health zones and 33 communities created by the NBHC, as well as by demographic groups. More information is available on our New Brunswick Student Wellness and Education Survey page.
Note about demographic groups:
In 2023, the NBHC undertook a review of the demographic questions in its surveys to more accurately report on the experience of citizens who identify with particular groups. As such, starting in 2024, all demographic groups (characteristics) have been adjusted to reflect this change. Data tables and indicator pages were adjusted to allow for trending where applicable.